

Question: Question 2 - ARL 2 points possible ( graded ) We have been using an x chart with 3 - limits with the parameters: UCL
Question ARL
points possible graded
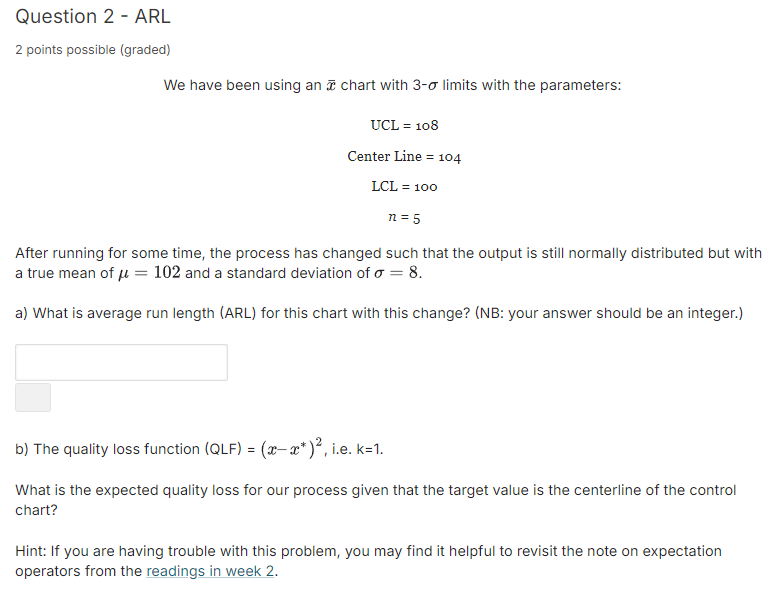
We have been using an chart with limits with the parameters:
UCL
Center Line
After running for some time, the process has changed such that the output is still normally distributed but with
a true mean of and a standard deviation of
a What is average run length ARL for this chart with this change? NB: your answer should be an integer.
b The quality loss function QLF ie
What is the expected quality loss for our process given that the target value is the centerline of the control
chart?
Hint: If you are having trouble with this problem, you may find it helpful to revisit the note on expectation
operators from the readings in week
Step by Step Solution
There are 3 Steps involved in it
1 Expert Approved Answer
Step: 1 Unlock

Question Has Been Solved by an Expert!
Get step-by-step solutions from verified subject matter experts
Step: 2 Unlock
Step: 3 Unlock