

Question: Question 2. Consider the decision tree shown in the figure below, and the corresponding training and test sets in the tables below. level 1 A
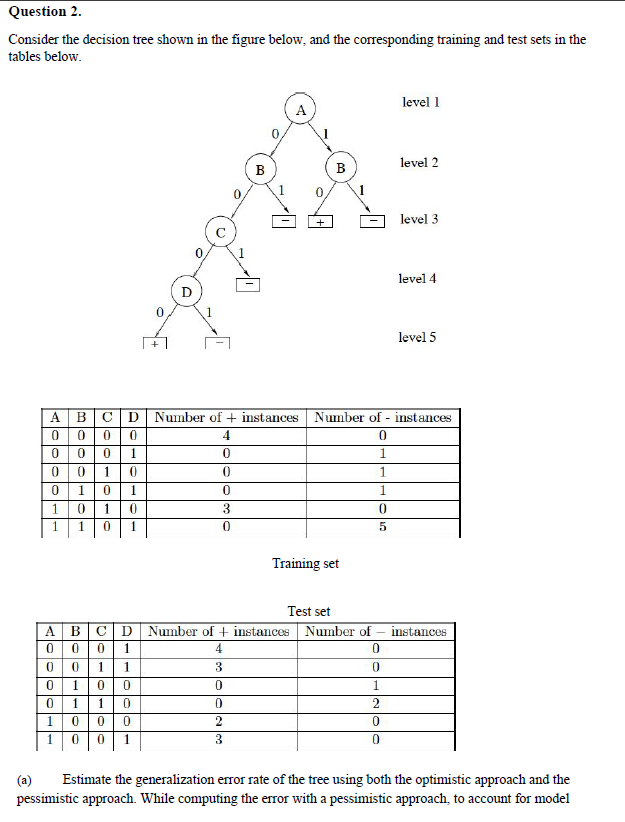

Question 2. Consider the decision tree shown in the figure below, and the corresponding training and test sets in the tables below. level 1 A 0 B B level 2 1 0 0 + level 3 level 4 0 level 5 0 4 0 lolololo A B C D Number of + instances Number of - instances 0 0 0 0 0 1 1 0 0 1 0 0 1 1 0 1 1 1 01 0 3 0 1 1 0 1 0 0 5 Training set instances Test set A BCD Number of + instances Number of 0 0 0 1 4 0 0 0 1 1 3 0 010 0 0 1 0 11 0 0 2 1 000 2 0 1 0 0 1 3 0 Estimate the generalization error rate of the tree using both the optimistic approach and the pessimistic approach. While computing the error with a pessimistic approach, to account for model (a) Estimate the generalization error rate of the tree using both the optimistic approach and the pessimistic approach. While computing the error with a pessimistic approach, to account for model complexity, use a penalty value of 2 at each leaf node. (6) Compute the error rate of the tree on the test set shown in the table above. (c) Compute the optimistic generalization error on the training set and the error on the test set when no pruning is done, and when pruning is done to get a pruned tree with 4 levels, 3 levels, and 2 levels. Note that the root node is at level 1. Comment on the behavior of training and test set errors with respect to model complexity on pruning from level 4 all the way up to level 2. (d) Using a penalty value of 2, compute the generalization error rate using the pessimistic approach on the pruned version of the original tree that has lowest error rate on the test set. Comment on the utility of incorporating model complexity in building a predictive model with respect to this question. Question 2. Consider the decision tree shown in the figure below, and the corresponding training and test sets in the tables below. level 1 A 0 B B level 2 1 0 0 + level 3 level 4 0 level 5 0 4 0 lolololo A B C D Number of + instances Number of - instances 0 0 0 0 0 1 1 0 0 1 0 0 1 1 0 1 1 1 01 0 3 0 1 1 0 1 0 0 5 Training set instances Test set A BCD Number of + instances Number of 0 0 0 1 4 0 0 0 1 1 3 0 010 0 0 1 0 11 0 0 2 1 000 2 0 1 0 0 1 3 0 Estimate the generalization error rate of the tree using both the optimistic approach and the pessimistic approach. While computing the error with a pessimistic approach, to account for model (a) Estimate the generalization error rate of the tree using both the optimistic approach and the pessimistic approach. While computing the error with a pessimistic approach, to account for model complexity, use a penalty value of 2 at each leaf node. (6) Compute the error rate of the tree on the test set shown in the table above. (c) Compute the optimistic generalization error on the training set and the error on the test set when no pruning is done, and when pruning is done to get a pruned tree with 4 levels, 3 levels, and 2 levels. Note that the root node is at level 1. Comment on the behavior of training and test set errors with respect to model complexity on pruning from level 4 all the way up to level 2. (d) Using a penalty value of 2, compute the generalization error rate using the pessimistic approach on the pruned version of the original tree that has lowest error rate on the test set. Comment on the utility of incorporating model complexity in building a predictive model with respect to this
Step by Step Solution
There are 3 Steps involved in it

Get step-by-step solutions from verified subject matter experts