

Question: QUESTION 2 In a consumer-preference study, a random sample of customers were asked to rate several attributes of a new product. The responses, on a
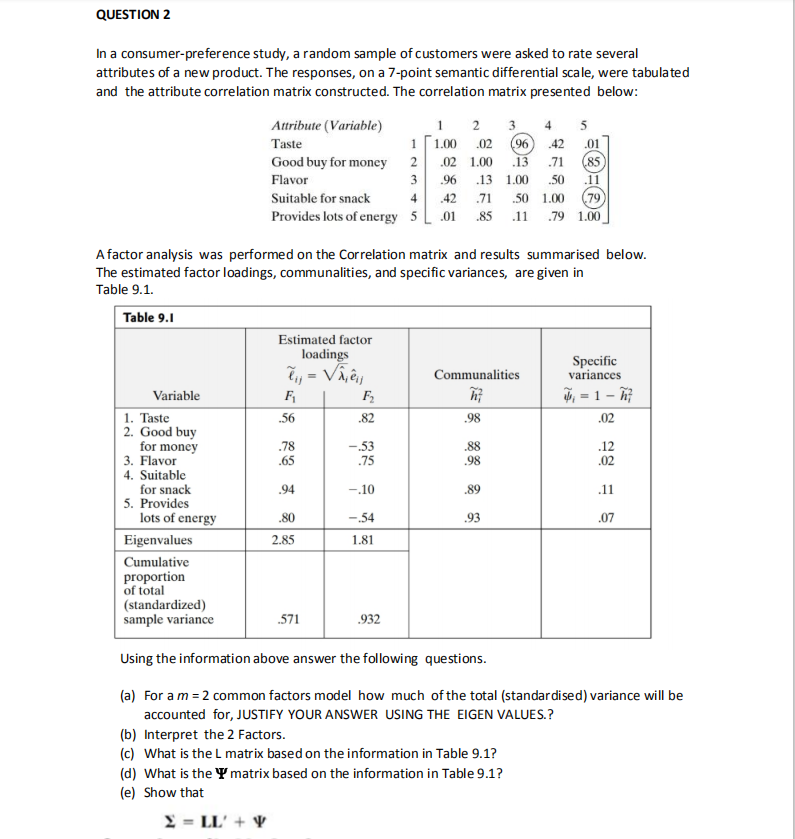
QUESTION 2 In a consumer-preference study, a random sample of customers were asked to rate several attributes of a new product. The responses, on a 7-point semantic differential scale, were tabulated and the attribute correlation matrix constructed. The correlation matrix presented below: Attribute (Variable) 2 Taste 1.00 .02 Good buy for money .02 1.00 .71 (85) Flavor .96 .13 1.00 .50 .11 Suitable for snack .42 .71 .50 1.00 (79 Provides lots of energy 5 01 85 .11 .79 1.00 A factor analysis was performed on the Correlation matrix and results summarised below. The estimated factor loadings, communalities, and specific variances, are given in Table 9.1. Table 9.1 Estimated factor loadings by = Vijey Specific Communalities variances Variable F2 4, = 1 - h; 1. Taste 56 .82 .98 .02 2. Good buy for money 78 -.53 88 .12 3. Flavor 65 75 98 02 4. Suitable for snack .94 -,10 89 .11 5. Provides lots of energy .80 -.54 .93 .07 Eigenvalues 2.85 1.81 Cumulative proportion of total (standardized) sample variance 571 .932 Using the information above answer the following questions. (a) For a m = 2 common factors model how much of the total (standardised) variance will be accounted for, JUSTIFY YOUR ANSWER USING THE EIGEN VALUES.? b) Interpret the 2 Factors. (c) What is the L matrix based on the information in Table 9.1? (d) What is the T' matrix based on the information in Table 9.1? (e) Show that Y = LL' +
Step by Step Solution
There are 3 Steps involved in it

Get step-by-step solutions from verified subject matter experts