Question: Question 2 Read the following case extract and answer ALL questions that follow. A management researcher is compiling a list of practices of managers that
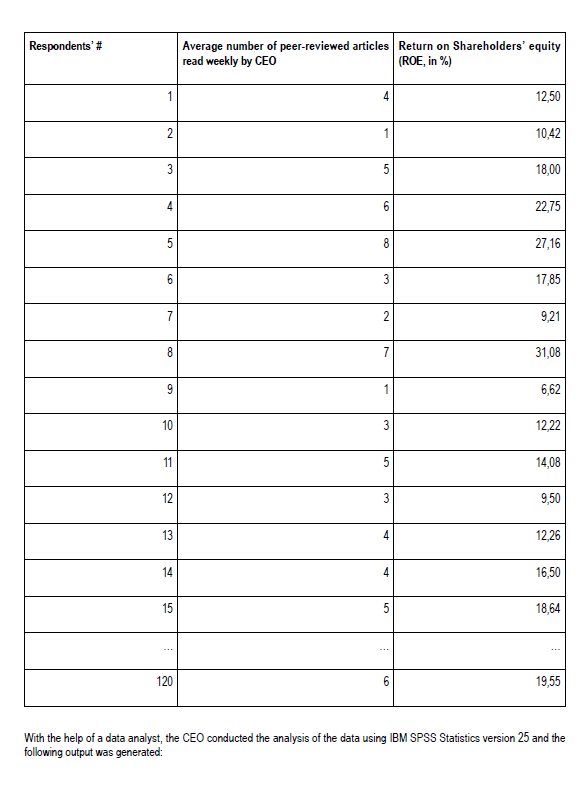
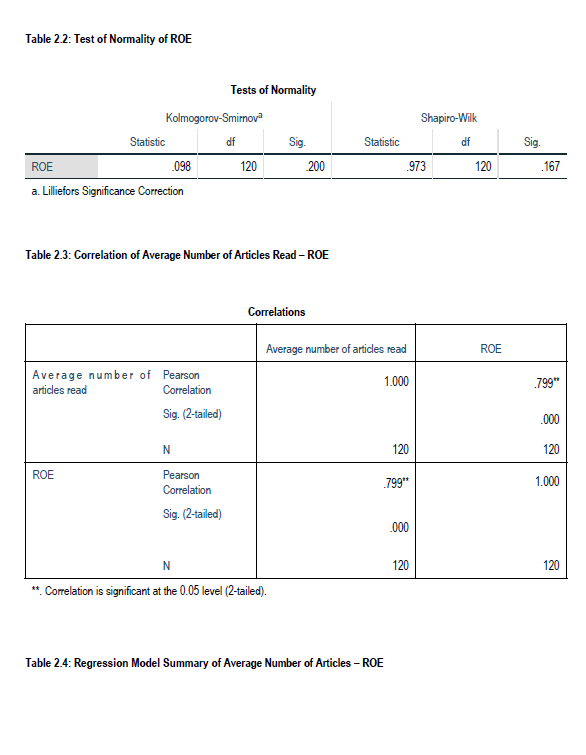
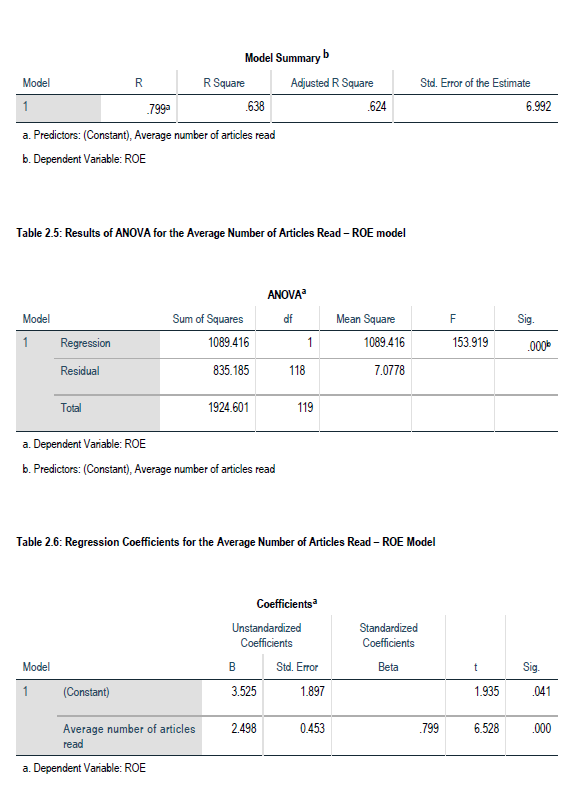
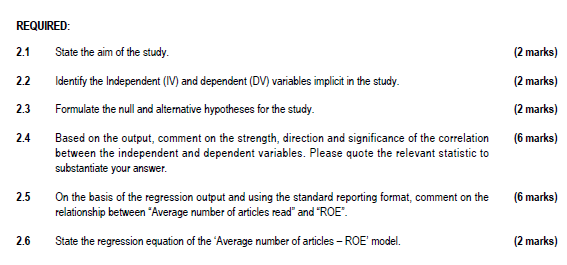
Question 2 Read the following case extract and answer ALL questions that follow. A management researcher is compiling a list of practices of managers that he thinks correlate with improved return on shareholders' equity. He suspects that the average number of peer-reviewed articles read weekly by the Chief Executive Officer (CEO) of a JSE-listed company could predict the return on shareholders' equity (ROE, measured in %). To test the veracity of his suspicion, he e-mailed a validated questionnaire to 200 CEOs of JSE-listed companies and received back 127 questionnaires of which 120 were usable (see Table 2.1, below). Table 2.1, below, is an excerpt of the data gathered from the 120 CEOs. Each row in the table shows the number of peer- reviewed articles read weekly by CEO and the return on shareholders' equity of the JSE-listed companies of which the CEO is the leader. Table 2.1: Excerpt of data gathered from 120 CEOs of JSE-listed firms. Respondents' # Average number of peer-reviewed articles Return on Shareholders' equity read weekly by CEO (ROE, in %) 12,50 N 10,42 3 5 18,00 4 22,75 5 27,16 6 3 17,85 7 2 9,21 8 7 31,08 9 1 6,62 10 3 12,22 11 5 5 14,08 12 3 9,50 13 4 12,26 14 16,50 15 18,64 120 6 19,55 With the help of a data analyst, the CEO conducted the analysis of the data using IBM SPSS Statistics version 25 and the following output was generated: Table 22: Test of Normality of ROE Tests of Normality Shapiro-Wilk Kolmogorov-Smirnova Statistic df .098 120 Statistic df Sig. 200 Sig. .167 ROE 973 120 a. Lilliefors Significance Correction Table 2.3: Correlation of Average Number of Articles Read ROE Correlations Average number of articles read ROE 1.000 .799 Average number of Pearson articles read Correlation Sig. (2-tailed) .000 N 120 120 ROE Pearson Correlation .799** 1.000 Sig. (2-tailed) .000 120 120 N Correlation is significant at the 0.05 level (2-tailed). Table 24: Regression Model Summary of Average Number of Articles - ROE Model Summary b Model R R Square Adjusted R Square 1 .7992 .638 .624 a. Predictors: (Constant), Average number of articles read b. Dependent Variable: ROE Std. Error of the Estimate 6.992 Table 2.5: Results of ANOVA for the Average Number of Articles Read ROE model F ANOVA df 1 Model 1 Sig. Sum of Squares 1089.416 835.185 Mean Square 1089.416 153.919 Regression Residual .000 118 7.0778 Total 1924.601 119 a. Dependent Variable: ROE b. Predictors: (Constant), Average number of articles read Table 2.6: Regression Coefficients for the Average Number of Articles Read ROE Model Coefficients Unstandardized Coefficients B Sta. Error 3.525 1.897 Standardized Coefficients Beta Model Sig. .041 1 (Constant) 1.935 2.498 0.453 .799 Average number of articles read 6.528 .000 a. Dependent Variable: ROE REQUIRED: 2.1 (2 marks) 2.2 (2 marks) (2 marks) 2.3 2.4 State the aim of the study. Identify the Independent (IV) and dependent (DV) variables implicit in the study. Formulate the null and alternative hypotheses for the study. Based on the output, comment on the strength, direction and significance of the correlation between the independent and dependent variables. Please quote the relevant statistic to substantiate your answer. On the basis of the regression output and using the standard reporting format, comment on the relationship between "Average number of articles read" and "ROE". (6 marks) 2.5 (6 marks) 2.6 State the regression equation of the 'Average number of articles - ROE' model. (2 marks)


