

Question: Question 2 . Suppose that g ( t ) represents the rate o f C O 2 emissions t { : K g d a
Question Suppose that represents the rate emissions : What does represent?
Question Put the following values order from smallest largest.
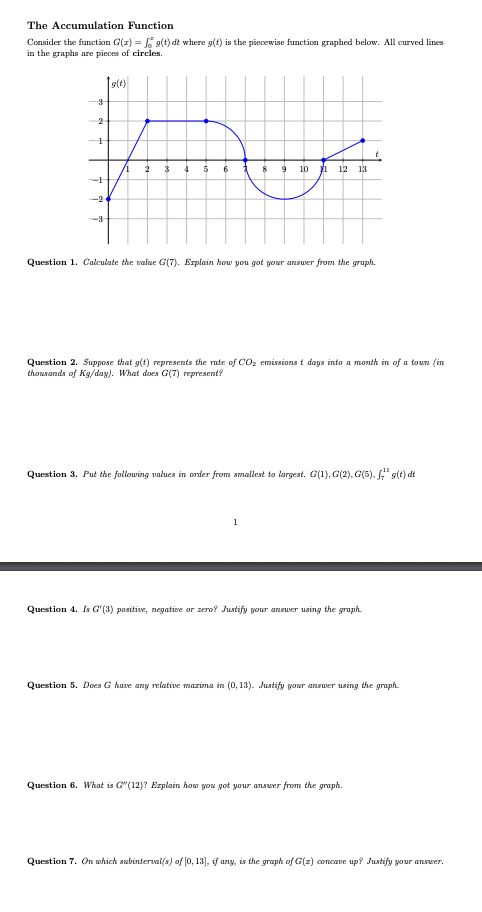
The Accumulation Function
Consider the function where the piecewise function graphed below. All curved lines
the graphs are pieces circles.
Question Calculate the value Explain how you got gour answer from the graph.
Question Suppose that represents the rate emissions : What does represent?
Question Put the following values order from smallest largest.
Question positive, negative zero? Justify pow ansuer using the graph.
Question Does have any relative maxima Justify gow answer using the graph.
Question What Explain how gow got your answer from the graph.
Step by Step Solution
There are 3 Steps involved in it
1 Expert Approved Answer
Step: 1 Unlock

Question Has Been Solved by an Expert!
Get step-by-step solutions from verified subject matter experts
Step: 2 Unlock
Step: 3 Unlock