

Question: Question 2: The graph below was produced after recording the processing costs of Friends Products observed over the last 10 months using the following data:
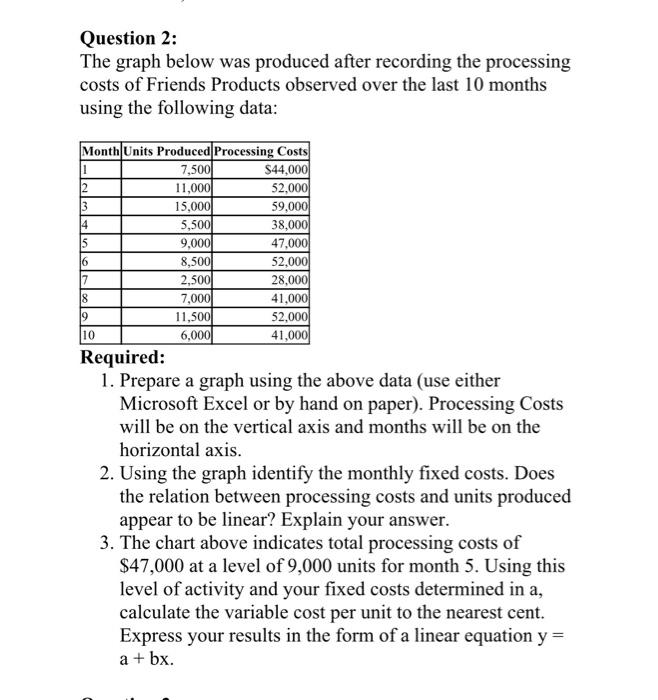
Question 2: The graph below was produced after recording the processing costs of Friends Products observed over the last 10 months using the following data: Required: 1. Prepare a graph using the above data (use either Microsoft Excel or by hand on paper). Processing Costs will be on the vertical axis and months will be on the horizontal axis. 2. Using the graph identify the monthly fixed costs. Does the relation between processing costs and units produced appear to be linear? Explain your answer. 3. The chart above indicates total processing costs of $47,000 at a level of 9,000 units for month 5 . Using this level of activity and your fixed costs determined in a, calculate the variable cost per unit to the nearest cent. Express your results in the form of a linear equation y= a+bx
Step by Step Solution
There are 3 Steps involved in it

Get step-by-step solutions from verified subject matter experts