

Question: The graph below was produced after recording the processing costs of Johnson Products observed over the last 10 months using the following data: Month 1
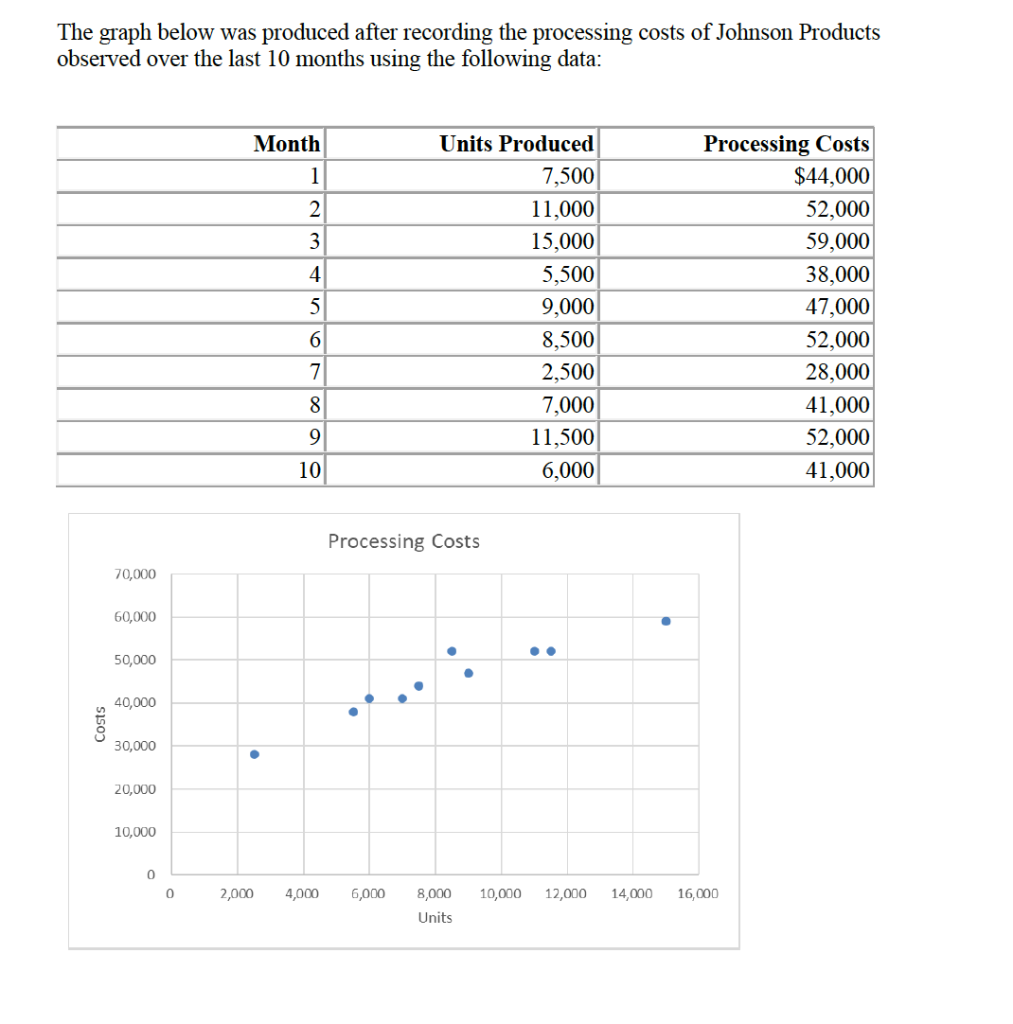
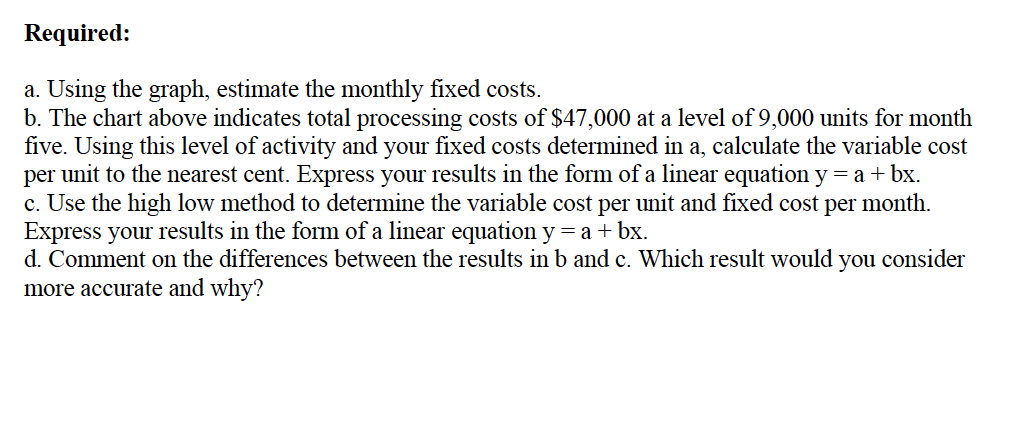
The graph below was produced after recording the processing costs of Johnson Products observed over the last 10 months using the following data: Month 1 2 3 4 5 Units Produced 7,500 11,000 15,000 5,500 9,000 8,500 2,500 7,000 11,500 6,000 Processing Costs $44,000 52,000 59,000 38,000 47,000 52,000 28,000 41,000 52,000 41,000 6 7 8 9 10 Processing Costs 70,000 60,000 O 50,000 40,000 Costs 30,000 . 20,000 10,000 0 0 2,000 4,000 6,000 10,000 12,000 14,000 16,000 8,000 Units Required: a. Using the graph, estimate the monthly fixed costs. b. The chart above indicates total processing costs of $47,000 at a level of 9,000 units for month five. Using this level of activity and your fixed costs determined in a, calculate the variable cost per unit to the nearest cent. Express your results in the form of a linear equation y=a + bx. c. Use the high low method to determine the variable cost per unit and fixed cost per month. Express your results in the form of a linear equation y=a + bx. d. Comment on the differences between the results in b and c. Which result would you consider more accurate and why
Step by Step Solution
There are 3 Steps involved in it

Get step-by-step solutions from verified subject matter experts