

Question: Question #2: Using the following graph to answer the following questions: 1 1 1 topcores and costs |d a lla is) 60 1.101 5.010 Notes:
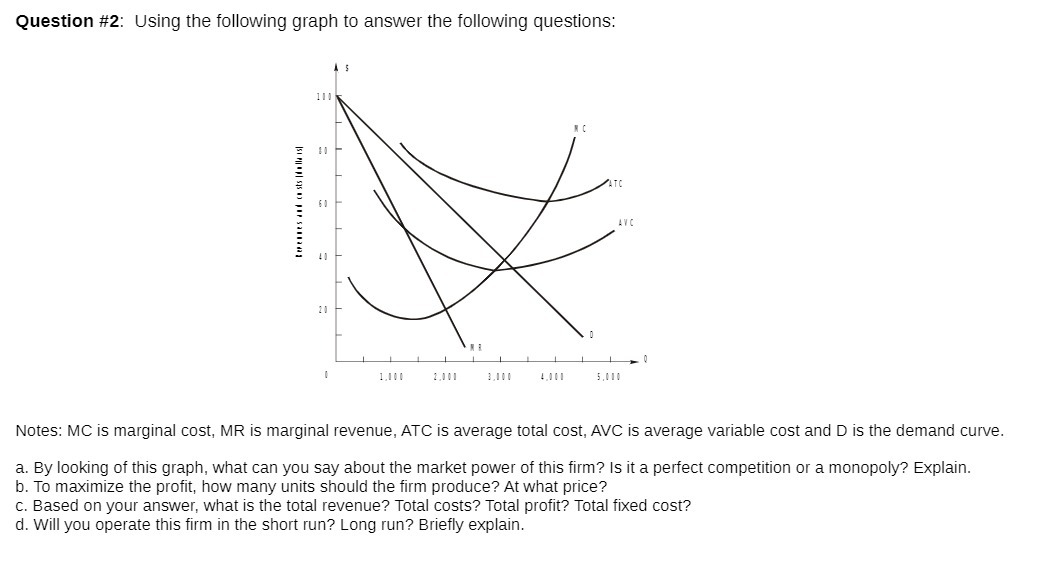
Question #2: Using the following graph to answer the following questions: 1 1 1 topcores and costs |d a lla is) 60 1.101 5.010 Notes: MC is marginal cost, MR is marginal revenue, ATC is average total cost, AVC is average variable cost and D is the demand curve. a. By looking of this graph, what can you say about the market power of this firm? Is it a perfect competition or a monopoly? Explain. b. To maximize the profit, how many units should the firm produce? At what price? c. Based on your answer, what is the total revenue? Total costs? Total profit? Total fixed cost? d. Will you operate this firm in the short run? Long run? Briefly explain
Step by Step Solution
There are 3 Steps involved in it

Get step-by-step solutions from verified subject matter experts