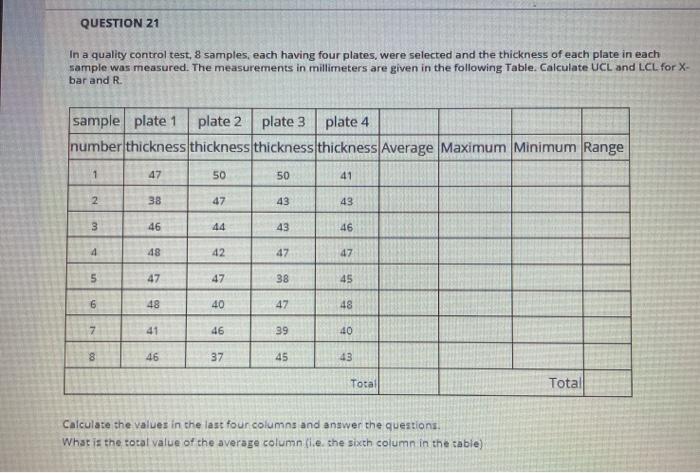
Question: QUESTION 21 In a quality control test, 8 samples, each having four plates, were selected and the thickness of each plate in each sample was

QUESTION 21 In a quality control test, 8 samples,
QUESTION 21 In a quality control test, 8 samples, each having four plates, were selected and the thickness of each plate in each sample was measured. The measurements in millimeters are given in the following Table. Calculate UCL and LCL for X- bar and R. sample plate 1 plate 2 plate 3 plate 4 number thickness thickness thickness thickness Average Maximum Minimum Range 1 47 50 50 41 2 38 47 43 43 3 46 44 43 46 48 42 47 47 un 47 47 38 45 6 48 40 47 48 41 46 39 40 46 37 45 43 Total Total Calculate the values in the last four columns and answer the questions, What is the total value of the average column(ie the sixth column in the table) QUESTION 28 Refer to the problem in question 21. What is the Lower Control Limit, LCL(X)? QUESTION 29 Refer to the problem in question 21. What is the Upper Control Limit, UCL(R)? QUESTION 30 Refer to the problem in question 21. What is the Lower Control Limit, LCL(R)? (Hint: First, you need to read the value of D3 from the Chart)

Step by Step Solution

There are 3 Steps involved in it

1 Expert Approved Answer
Step: 1 Unlock blur-text-image
Question Has Been Solved by an Expert!

Get step-by-step solutions from verified subject matter experts

Step: 2 Unlock
Step: 3 Unlock

Students Have Also Explored These Related General Management Questions!