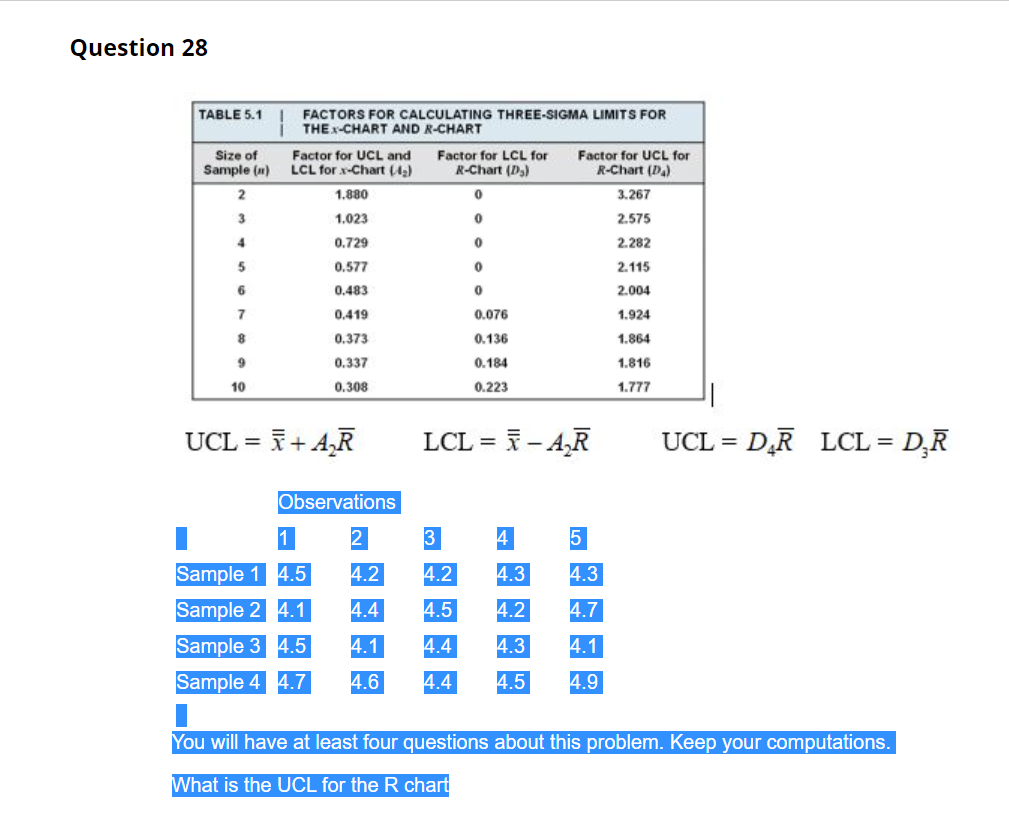
Question: Question 28 TABLE 5.1 FACTORS FOR CALCULATING THREE-SIGMA LIMITS FOR THE X-CHART AND R-CHART Size of Factor for UCL and Factor for LCL for Factor

Question 28 TABLE 5.1 FACTORS FOR CALCULATING

Question 28 TABLE 5.1 FACTORS FOR CALCULATING THREE-SIGMA LIMITS FOR THE X-CHART AND R-CHART Size of Factor for UCL and Factor for LCL for Factor for UCL for Sample (1) LCL for X-Chart (43) R-Chart (1) R-Chart (D) 1.880 0 3.267 3 1.023 0 2.575 4 0.729 0 2.282 5 0.577 0 2.115 6 0.483 0 2.004 7 0.419 0.076 1.924 8 0.373 0.136 1.864 9 0.337 0.184 1.816 10 0.308 0.223 1.777 UCL = + AR = LCL = - AR UCL = D_ LCL = D.R = = Observations 2 4 5 4.2 4.2 4.3 4.3 4.4 4.5 4.7 Sample 1 4.5 Sample 2 4.1 Sample 3 4.5 Sample 4 4.7 4.2 4.3 4.1 4.1 4.4 4.4 4.6 4.5 4.9 You will have at least four questions about this problem. Keep your computations. What is the UCL for the R chart

Step by Step Solution

There are 3 Steps involved in it

1 Expert Approved Answer
Step: 1 Unlock blur-text-image
Question Has Been Solved by an Expert!

Get step-by-step solutions from verified subject matter experts

Step: 2 Unlock
Step: 3 Unlock

Students Have Also Explored These Related General Management Questions!