

Question: QUESTION 3 0 The following sample values represent service times in minutes. Center lines for the R chart and x - bar chart should be
QUESTION
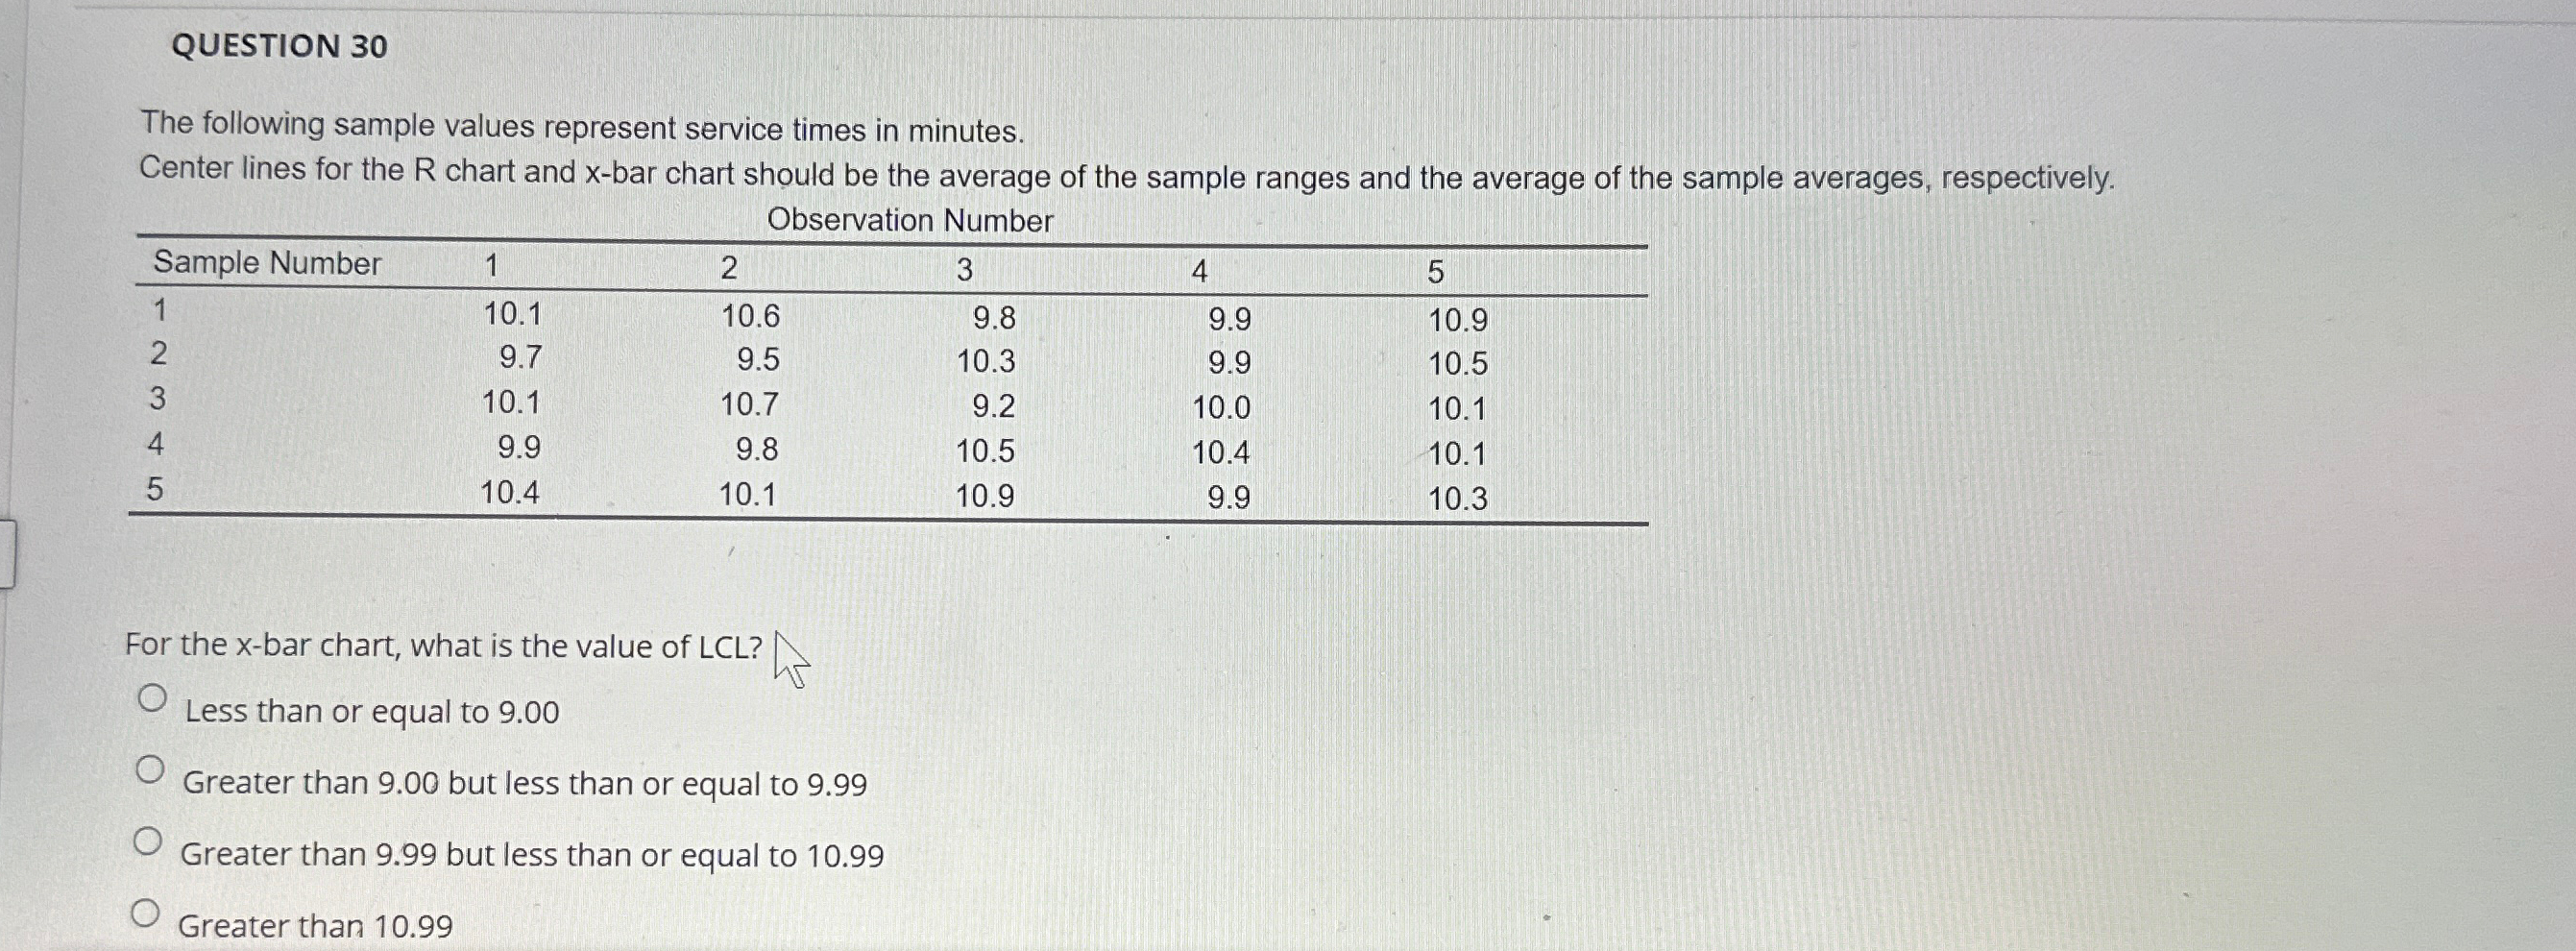
The following sample values represent service times in minutes.
Center lines for the chart and bar chart should be the average of the sample ranges and the average of the sample averages, respectively.
tableObservation Number,Sample Number,
For the bar chart, what is the value of
Less than or equal to
Greater than but less than or equal to
Greater than but less than or equal to
Greater than
Step by Step Solution
There are 3 Steps involved in it
1 Expert Approved Answer
Step: 1 Unlock

Question Has Been Solved by an Expert!
Get step-by-step solutions from verified subject matter experts
Step: 2 Unlock
Step: 3 Unlock