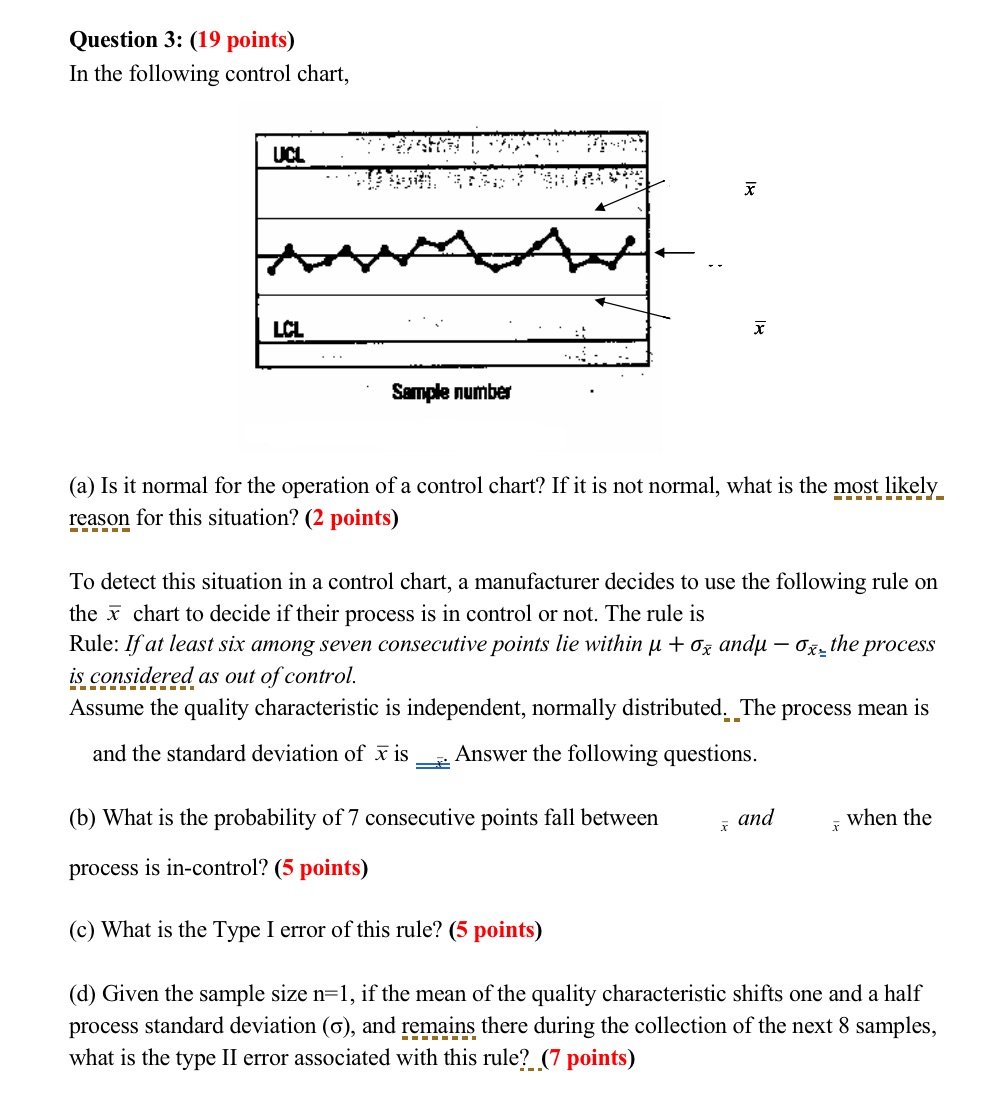
Question: Question 3: (19 points) In the following control chart, UCL LCL . . . Sample number (a) Is it normal for the operation of a

Question 3: (19 points) In the following control
Question 3: (19 points) In the following control chart, UCL LCL . . . Sample number (a) Is it normal for the operation of a control chart? If it is not normal, what is the most likely_ reason for this situation? (2 points) To detect this situation in a control chart, a manufacturer decides to use the following rule on the x chart to decide if their process is in control or not. The rule is Rule: If at least six among seven consecutive points lie within u + of andu - OF the process is considered as out of control. Assume the quality characteristic is independent, normally distributed. The process mean is and the standard deviation of x is _ Answer the following questions. (b) What is the probability of 7 consecutive points fall between x and + when the process is in-control? (5 points) (c) What is the Type I error of this rule? (5 points) (d) Given the sample size n=1, if the mean of the quality characteristic shifts one and a half process standard deviation (), and remains there during the collection of the next 8 samples, what is the type II error associated with this rule? (7 points)

Step by Step Solution

There are 3 Steps involved in it

1 Expert Approved Answer
Step: 1 Unlock blur-text-image
Question Has Been Solved by an Expert!

Get step-by-step solutions from verified subject matter experts

Step: 2 Unlock
Step: 3 Unlock

Students Have Also Explored These Related Law Questions!