

Question: OPMT Q2 (7 points). A machine at the Pacific Fruit Company fills boxes with raisins. The labeled weight of the boxes is 9 oz. The
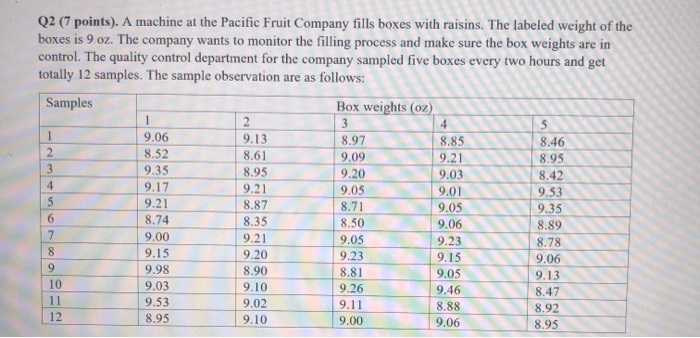
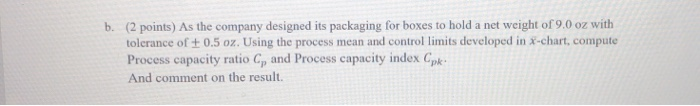
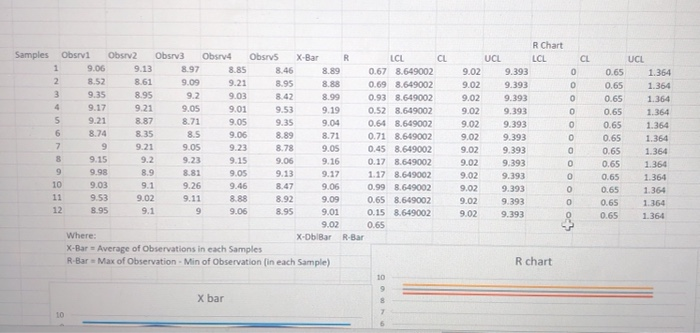
Q2 (7 points). A machine at the Pacific Fruit Company fills boxes with raisins. The labeled weight of the boxes is 9 oz. The company wants to monitor the filling process and make sure the box weights are in control. The quality control department for the company sampled five boxes every two hours and get totally 12 samples. The sample observation are as follows: Samples Box weights (oz) 1 2 3 4 5 1 9.06 9.13 8.97 8.85 8.46 2 8.52 8.61 9.09 9.21 8.95 3 9.35 8.95 9.20 9.03 8.42 4 9.17 9.21 9.05 9.01 9.53 5 9.21 8.87 8.71 9.05 9.35 6 8.74 8.35 8.50 9.06 8.89 7 9.00 9.21 9.05 9.23 8.78 8 9.15 9.20 9.23 9.15 9.06 9 9.98 8.90 8.81 9.05 9.13 10 9.03 9.10 9.26 9.46 8.47 11 9.53 9.02 9.11 8.88 8.92 12 8.95 9.10 9.00 9.06 8.95 b. (2 points) As the company designed its packaging for boxes to hold a net weight of 9.0 oz with tolerance of +0.5 oz. Using the process mean and control limits developed in X-chart, compute Process capacity ratio C, and Process capacity index pk. And comment on the result. CL 8.88 Samples Obsvi Obsrv2 Obsrv3 Obsv4 Obsrvs X-Bar R LCL CL 1 9.06 9.13 8.97 8.85 8.46 8.89 0.67 8.649002 2 8.52 8.61 9.09 9.21 8.95 0.69 8.649002 3 9.35 8.95 9.2 9.03 8.42 8.99 0.938.649002 4 9.17 9.21 9.05 9.01 9.53 9.19 0.52 8.649002 5 9.21 8.87 8.71 9.05 9.35 9.04 0.64 8.649002 6 8.74 8.35 85 9.06 8.89 8.71 0.71 8.649002 7 9 9.21 9.05 9.23 8.78 9.05 0.45 8.649002 8 9.15 9.2 9.23 9.15 9.06 9.16 0.17 8.649002 9 9.98 9.05 9.13 9.17 1.17 8.649002 10 9.03 9.1 9.26 9.46 8.47 9.06 0.99 8.649002 11 9.53 9.02 9.11 8.88 8.92 9.09 0.65 8.649002 12 8.95 9.1 9 9.06 8.95 9.01 0.15 8.649002 9.02 0.65 Where: X-DblBar R-Bar X-Bar - Average of Observations in each Samples R-Bar Max of Observation - Min of Observation in each Sample) 10 9 X bar 8 R Chart UCL LCL 9.02 9.393 9.02 9.393 9.02 9.393 9.02 9.393 9.02 9.393 9.02 9.393 9.02 9.393 9.02 9.393 9.02 9.393 9.02 9.393 9.02 9.393 9.02 9.393 UCL 0.65 1.364 0.65 1.364 0.65 1.364 0.65 1.364 0.65 1.364 0.65 1.364 0.65 1.364 1.364 0.65 1.364 0.65 1.364 0.65 1.364 0.65 1.364 0.65 R chart 7 10
Step by Step Solution
There are 3 Steps involved in it

Get step-by-step solutions from verified subject matter experts