

Question: > Question 3 20 pts B D E F G H 1 14 Inputs 2 The Covariance Matrix 15 Portfolio 16 Weights 0.8117 17 US
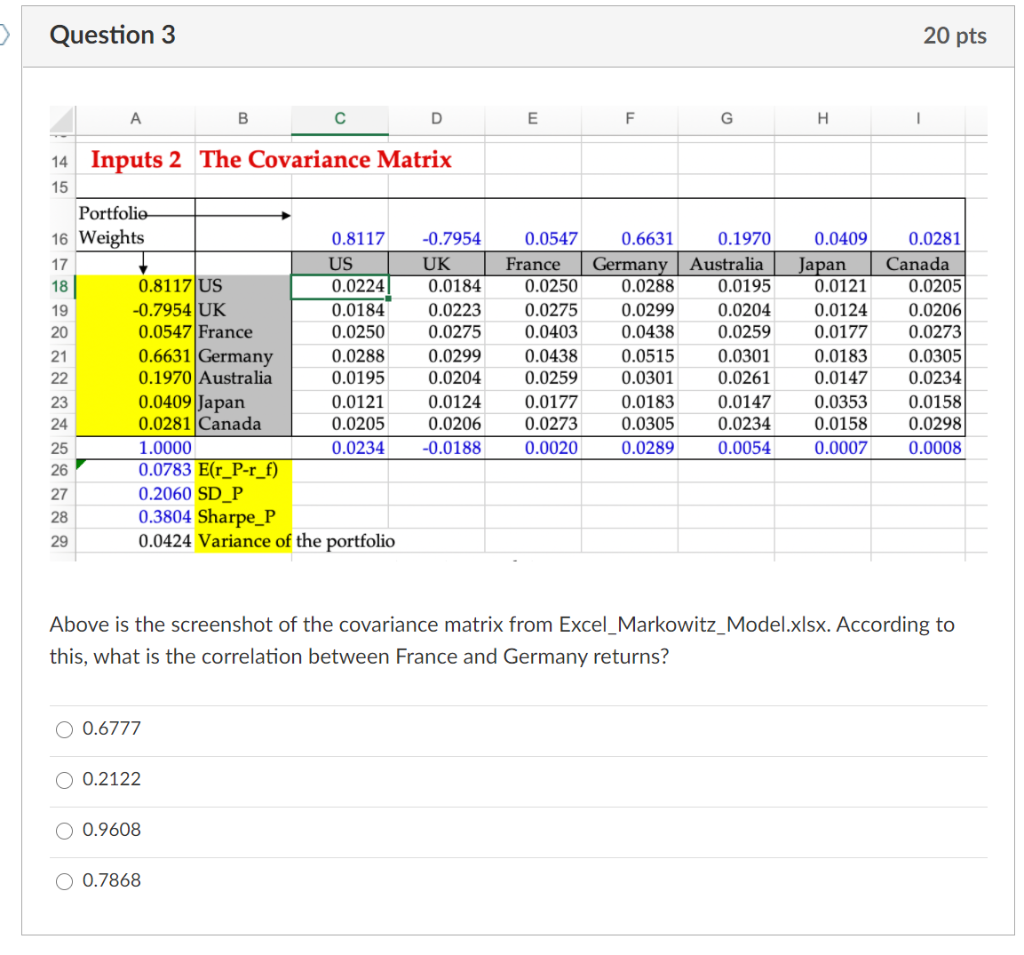
> Question 3 20 pts B D E F G H 1 14 Inputs 2 The Covariance Matrix 15 Portfolio 16 Weights 0.8117 17 US 18 0.8117 US 0.0224 19 -0.7954 UK 0.0184 20 0.0547 France 0.0250 21 0.6631 Germany 0.0288 22 0.1970 Australia 0.0195 23 0.0409 Japan 0.0121 24 0.0281 Canada 0.0205 25 1.0000 0.0234 26 0.0783 E(r_P-r_f) 27 0.2060 SD_P 28 0.3804 Sharpe_P 29 0.0424 Variance of the portfolio -0.7954 UK 0.0184 0.0223 0.0275 0.0299 0.0204 0.0124 0.0206 -0.0188 0.0547 France 0.0250 0.0275 0.0403 0.0438 0.0259 0.0177 0.0273 0.0020 0.6631 Germany 0.0288 0.0299 0.0438 0.0515 0.0301 0.0183 0.0305 0.0289 0.1970 Australia 0.0195 0.0204 0.0259 0.0301 0.0261 0.0147 0.0234 0.0054 0.0409 Japan 0.0121 0.0124 0.0177 0.0183 0.0147 0.0353 0.0158 0.0007 0.0281 Canada 0.0205 0.0206 0.0273 0.0305 0.0234 0.0158 0.0298 0.0008 Above is the screenshot of the covariance matrix from Excel_Markowitz_Model.xlsx. According to this, what is the correlation between France and Germany returns? 0.6777 0.2122 0.9608 O 0.7868
Step by Step Solution
There are 3 Steps involved in it

Get step-by-step solutions from verified subject matter experts