

Question: The Quarterly sales figures for a company are given in Table 1. Find the forecast for the first and second quarter of 2022 after
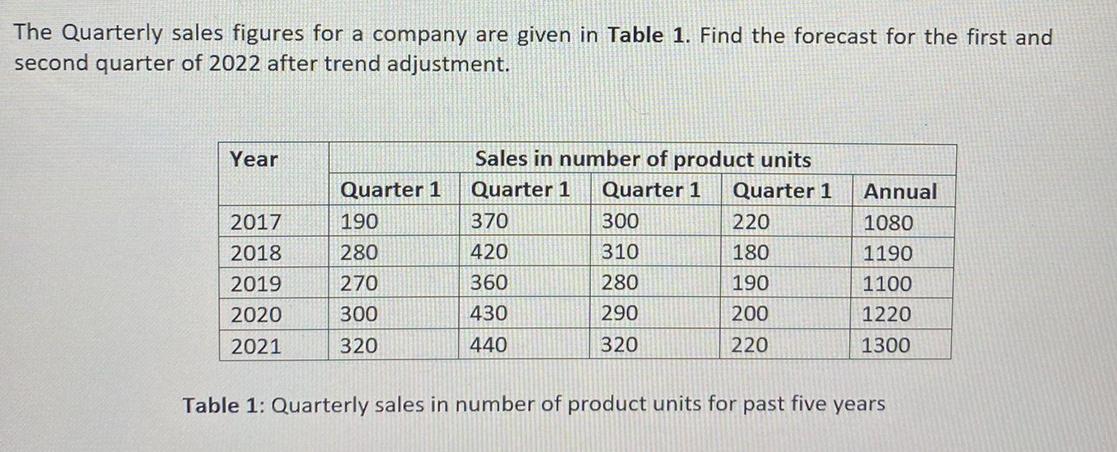
The Quarterly sales figures for a company are given in Table 1. Find the forecast for the first and second quarter of 2022 after trend adjustment. Year Sales in number of product units Quarter 1 Quarter 1 Quarter 1 Quarter 1 Annual 2017 190 370 300 220 1080 2018 280 420 310 180 1190 2019 270 360 280 190 1100 2020 300 430 290 200 1220 2021 320 440 320 220 1300 Table 1: Quarterly sales in number of product units for past five years
Step by Step Solution
3.48 Rating (155 Votes )
There are 3 Steps involved in it
For the given data we can have the forecasting analysis by Trend adjusted seasonality ... View full answer

Get step-by-step solutions from verified subject matter experts