

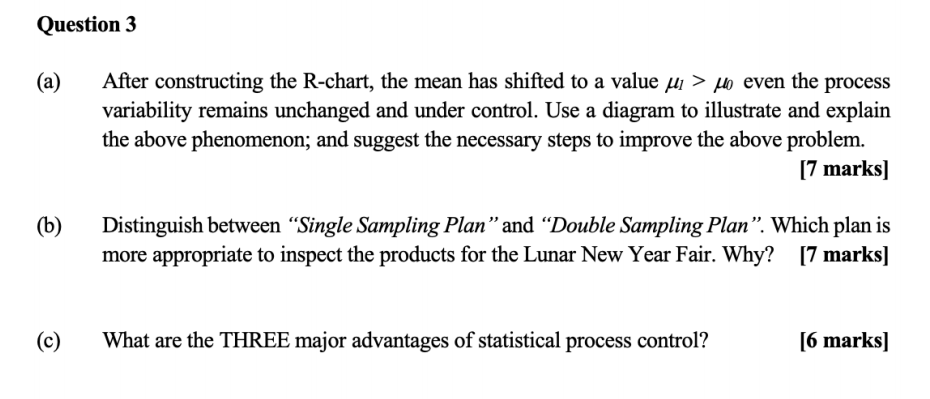
Question: Question 3 (a) After constructing the R-chart, the mean has shifted to a value li > Ho even the process variability remains unchanged and under
Step by Step Solution
There are 3 Steps involved in it
1 Expert Approved Answer
Step: 1 Unlock

Question Has Been Solved by an Expert!
Get step-by-step solutions from verified subject matter experts
Step: 2 Unlock
Step: 3 Unlock