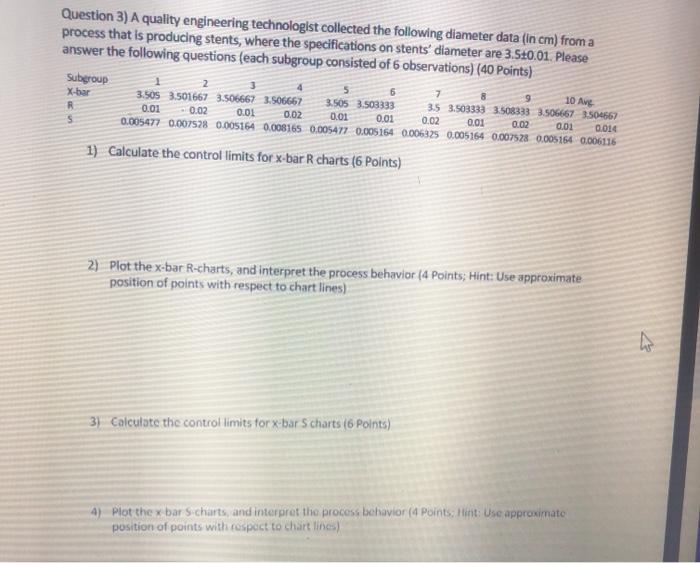
Question: Question 3) A quality engineering technologist collected the following diameter data (in cm) from a process that is producing stents, where the specifications on stents'

Question 3) A quality engineering technologist
Question 3) A quality engineering technologist collected the following diameter data (in cm) from a process that is producing stents, where the specifications on stents' diameter are 3.5+0.01. Please answer the following questions (each subgroup consisted of 6 observations) (40 points) Subgroup 9 3.505 3.501667 3.506667 3.566667 3.505 3.503333 3.5 3.503333 3.5083333.566667 3504667 R 0.01 -0.02 0.01 0.02 0.02 0.01 0.02 0.01 0.02 0.01 0.014 S 0.005477 0.007528 0.005164 0.008165 0.005477 0.005164 0.006325 0.005164 0.007528 0.005164 0.006116 1) Calculate the control limits for x-bar R charts (6 points) 6 10 Avg 2) Plot the x-bar R-charts, and interpret the process behavior (4 points; Hint: Use approximate position of points with respect to chart lines) 3) Calculate the control limits for x-bar 5 charts (6 points) 4) Plot the x bar Scharts, and interpret the process behavior (4 points, Hint: Use approximato position of points with respect to chat lines)

Step by Step Solution

There are 3 Steps involved in it

1 Expert Approved Answer
Step: 1 Unlock blur-text-image
Question Has Been Solved by an Expert!

Get step-by-step solutions from verified subject matter experts

Step: 2 Unlock
Step: 3 Unlock

Students Have Also Explored These Related General Management Questions!