

Question: Question 3 ( a ) The table below shows the field data for a line of levels between two stations A and G , 1
Question
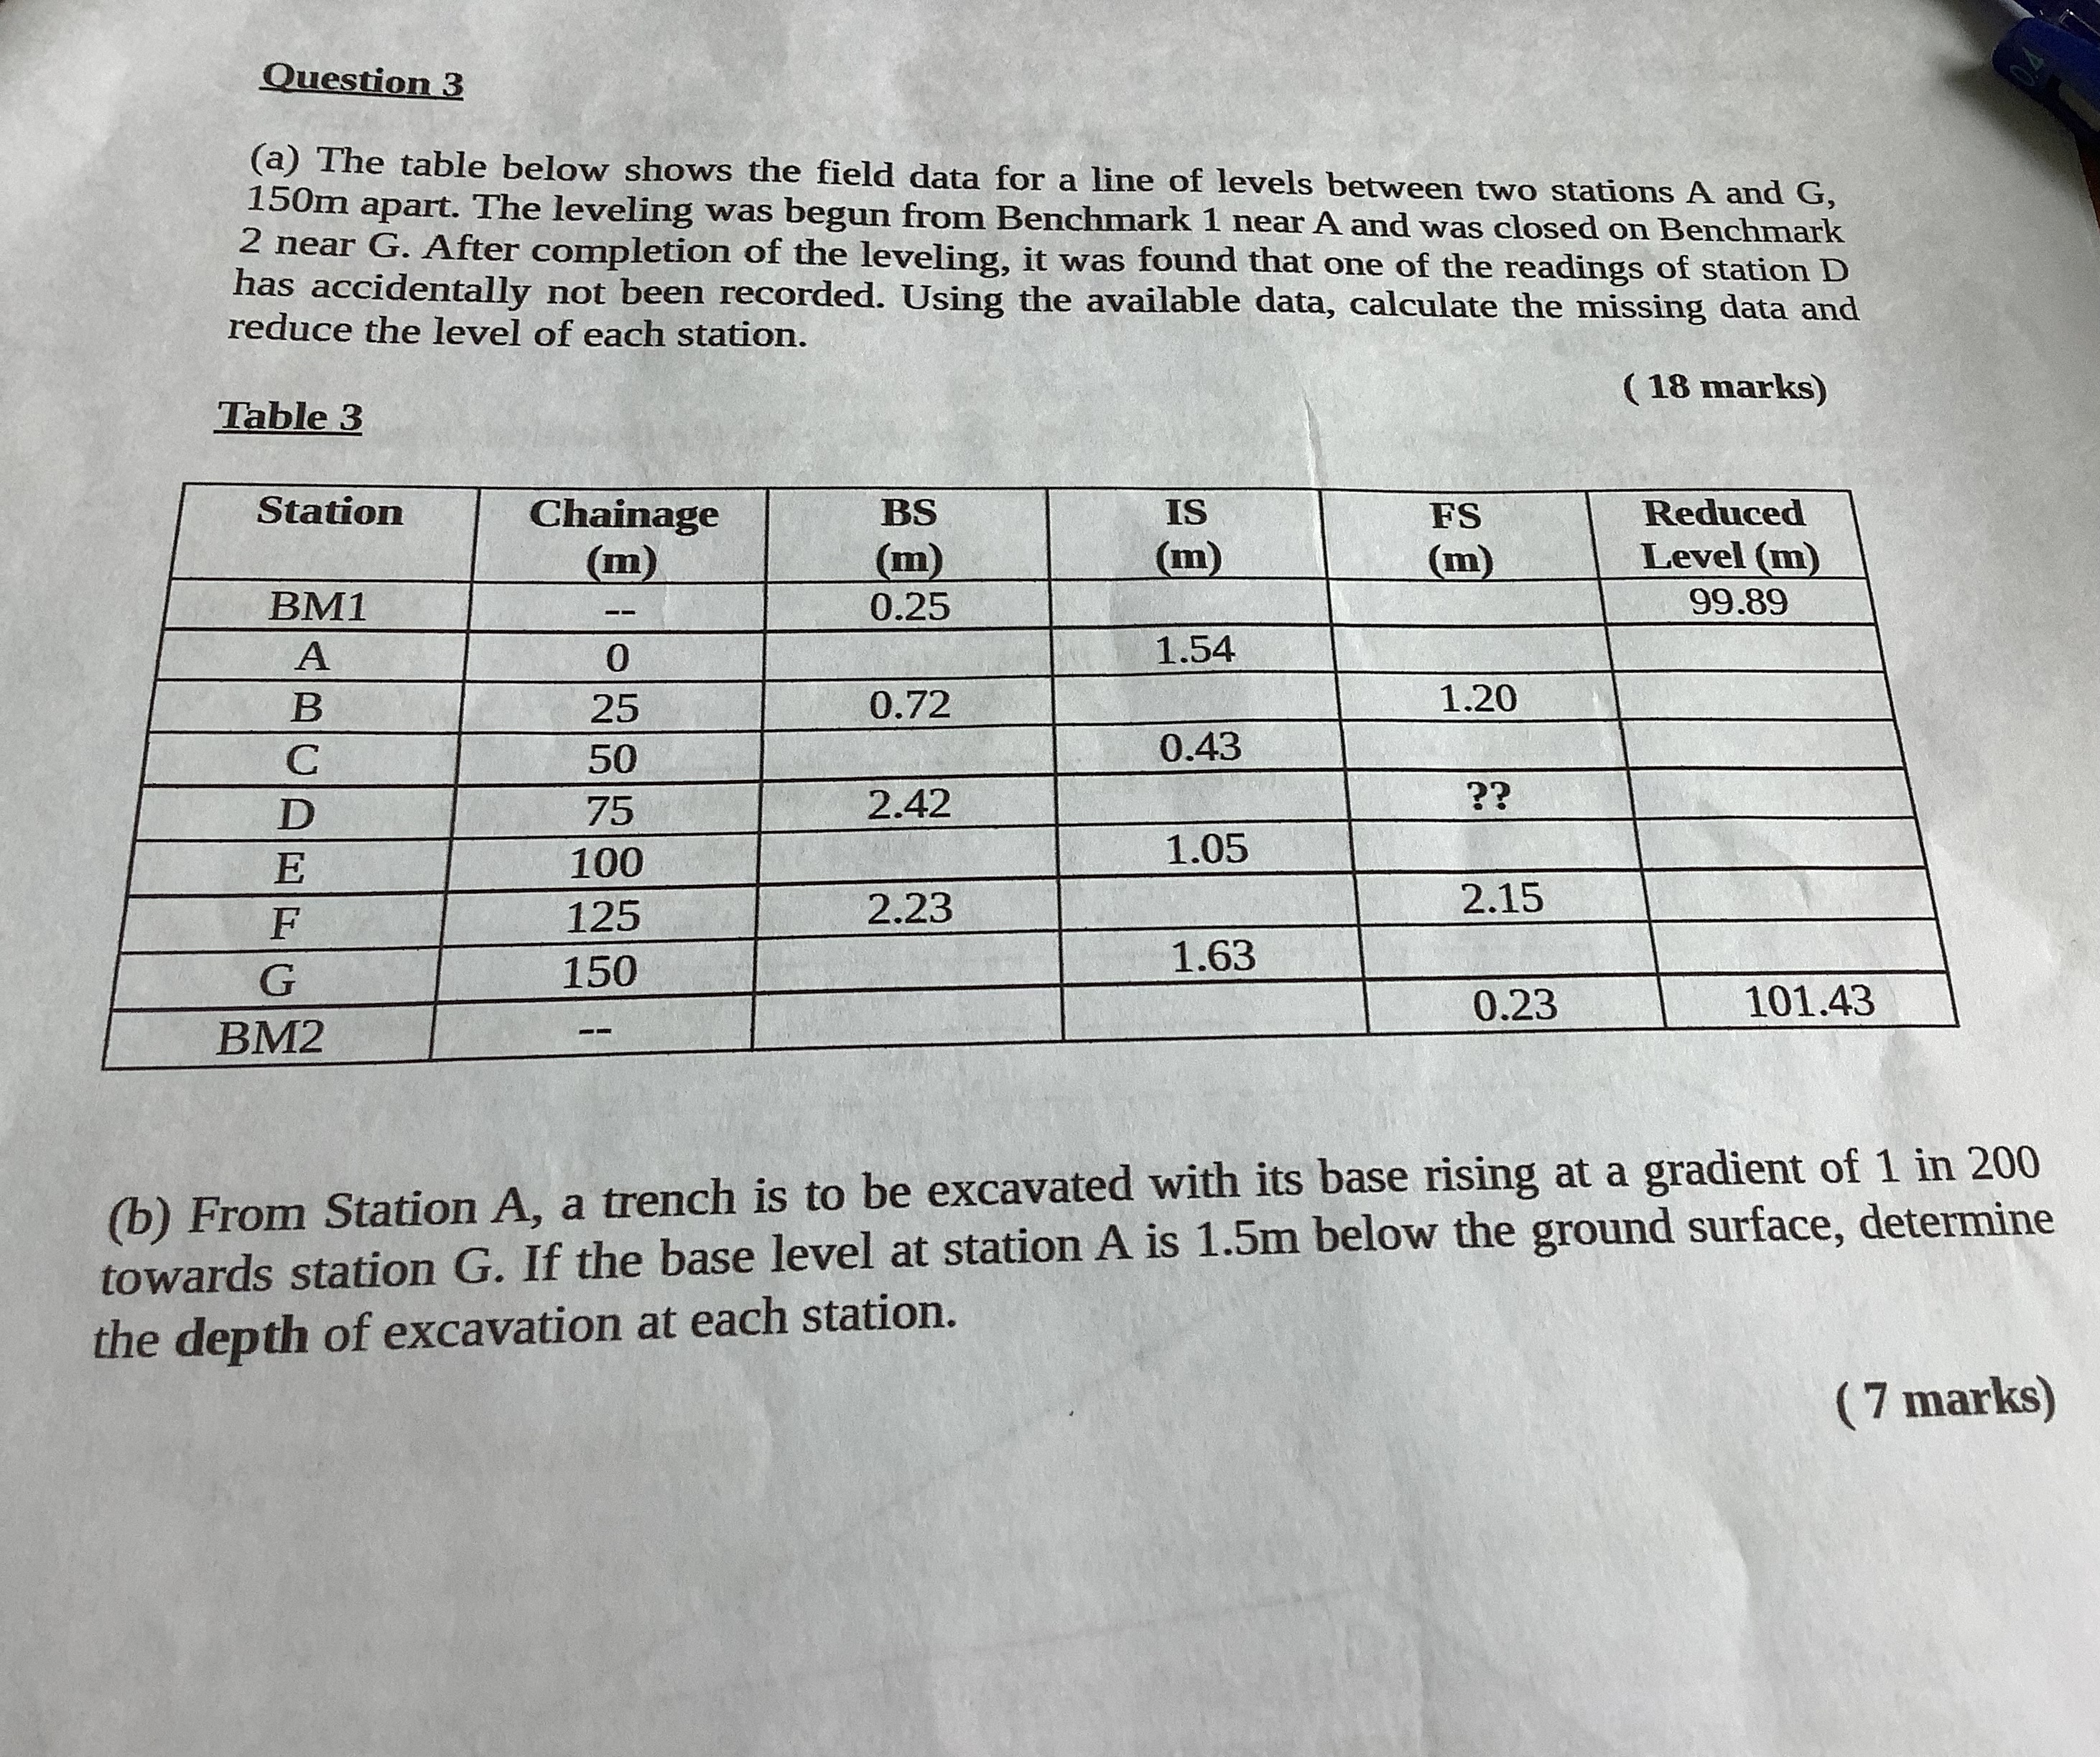
a The table below shows the field data for a line of levels between two stations A and apart. The leveling was begun from Benchmark near A and was closed on Benchmark near After completion of the leveling, it was found that one of the readings of station has accidentally not been recorded. Using the available data, calculate the missing data and reduce the level of each station.
Table
marks
tableStationtableChainagemtableBSmtableISmtableFSmtableReducedLevel mmBMABCDEFG
b From Station A a trench is to be excavated with its base rising at a gradient of in towards station If the base level at station is below the ground surface, determine the depth of excavation at each station.
marks
Step by Step Solution
There are 3 Steps involved in it
1 Expert Approved Answer
Step: 1 Unlock

Question Has Been Solved by an Expert!
Get step-by-step solutions from verified subject matter experts
Step: 2 Unlock
Step: 3 Unlock