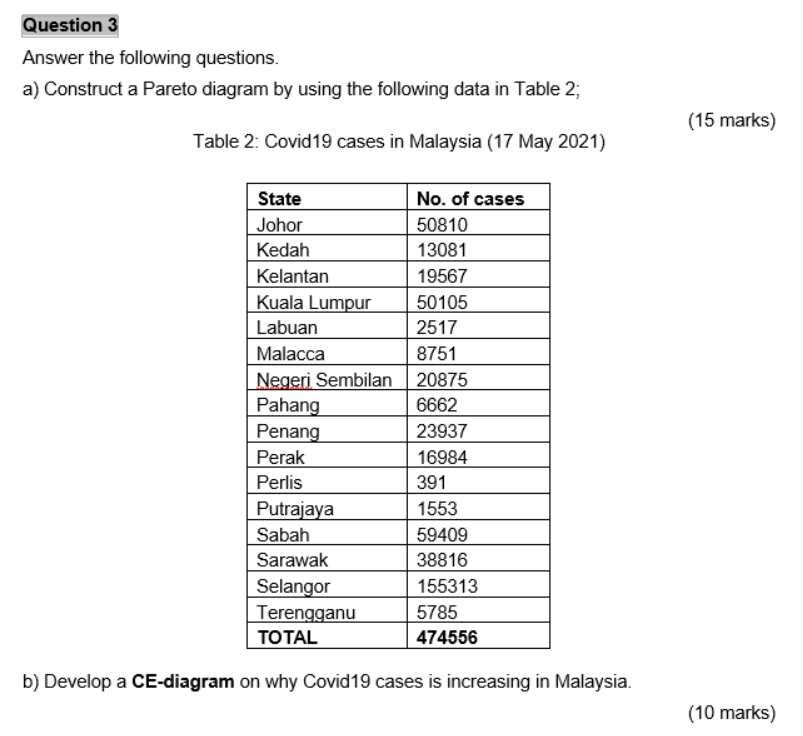
Question: Question 3 Answer the following questions. a) Construct a Pareto diagram by using the following data in Table 2; (15 marks) Table 2: Covid19 cases

Question 3 Answer the following questions. a)

Question 3 Answer the following questions. a) Construct a Pareto diagram by using the following data in Table 2; (15 marks) Table 2: Covid19 cases in Malaysia (17 May 2021) State No. of cases Johor 50810 Kedah 13081 Kelantan 19567 Kuala Lumpur 50105 Labuan 2517 Malacca 8751 Negeri Sembilan 20875 Pahang 6662 Penang 23937 Perak 16984 Perlis 391 Putrajaya 1553 Sabah 59409 Sarawak 38816 Selangor 155313 Terengganu 5785 TOTAL 474556 b) Develop a CE-diagram on why Covid19 cases is increasing in Malaysia. (10 marks)

Step by Step Solution

There are 3 Steps involved in it

1 Expert Approved Answer
Step: 1 Unlock blur-text-image
Question Has Been Solved by an Expert!

Get step-by-step solutions from verified subject matter experts

Step: 2 Unlock
Step: 3 Unlock

Students Have Also Explored These Related General Management Questions!