

Question: Find the equation of the regression line for the given data. Then construct a scatter plot of the data and draw the regression line.
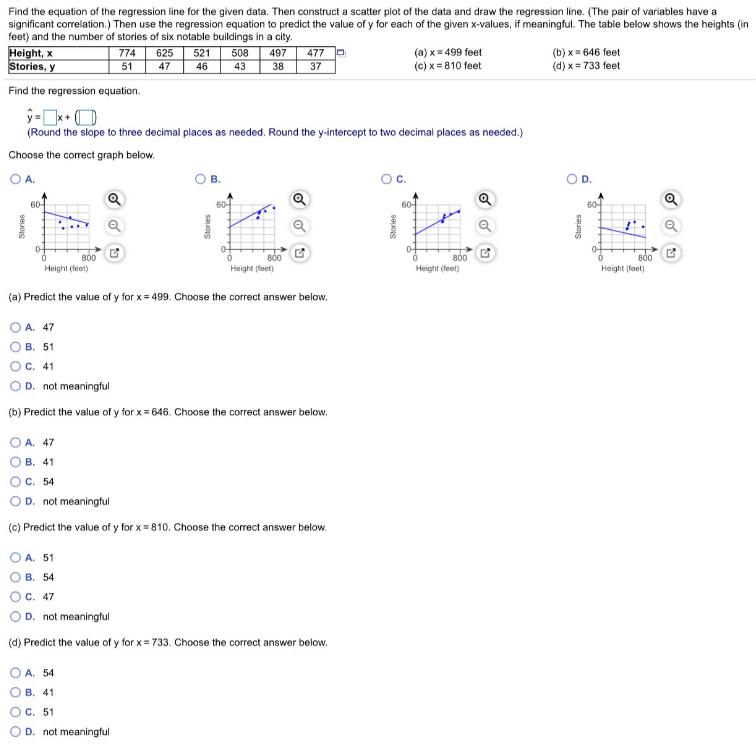
Find the equation of the regression line for the given data. Then construct a scatter plot of the data and draw the regression line. (The pair of variables have a significant correlation.) Then use the regression equation to predict the value of y for each of the given x-values, if meaningful. The table below shows the heights (in feet) and the number of stories of six notable buildings in a city. Height, x Stories, y (a) x= 499 feet (c) x = 810 feet (b) x = 646 feet (d) x = 733 feet 774 625 521 508 497 477 51 47 46 43 38 37 Find the regression equation. (Round the slope to three decimal places as needed. Round the y-intercept to two decimal places as needed.) Choose the correct graph below. OA. D. 60- 60 60- 60 B00 Height (leet) B00 Height (feet) 800 Height (feet) Height (feet) (a) Predict the value of y for x= 499. Choose the correct answer below. O A. 47 . 51 C. 41 D. not meaningful (b) Predict the value of y for x = 646. Choose the correct answer below. O A. 47 B. 41 . 54 O D. not meaningful (C) Predict the value of y for x = 810. Choose the correct answer below. O A. 51 . 54 C. 47 D. not meaningful (d) Predict the value of y for x = 733. Choose the correct answer below. O A. 54 . 41 . 51 D. not meaningful O O O O Stories C. Stories
Step by Step Solution
3.37 Rating (147 Votes )
There are 3 Steps involved in it

Get step-by-step solutions from verified subject matter experts