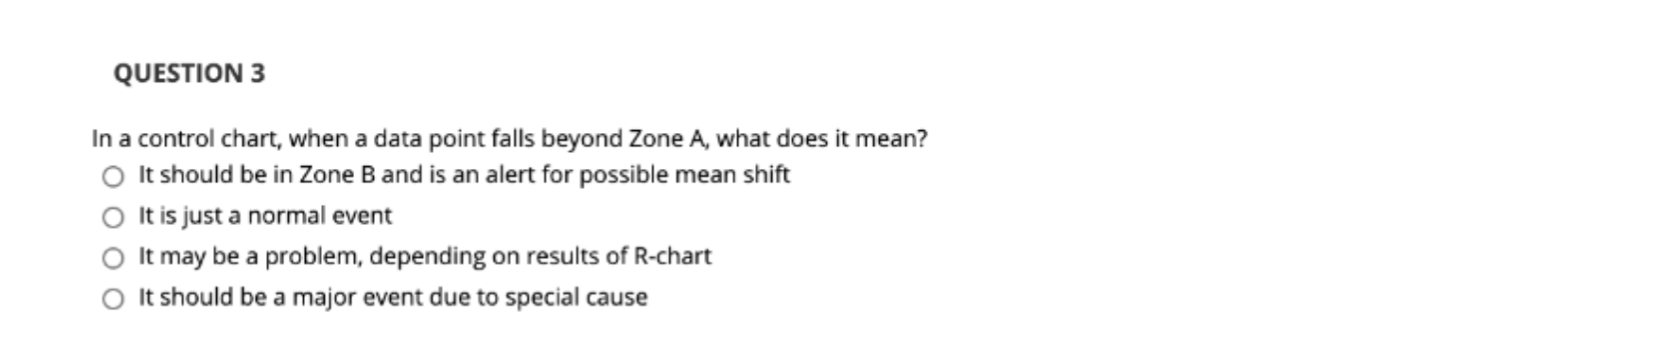
Question: QUESTION 3 In a control chart, when a data point falls beyond Zone A, what does it mean? It should be in Zone B and

QUESTION 3 In a control chart, when a data point

QUESTION 3 In a control chart, when a data point falls beyond Zone A, what does it mean? It should be in Zone B and is an alert for possible mean shift It is just a normal event It may be a problem, depending on results of R-chart o It should be a major event due to special cause

Step by Step Solution

There are 3 Steps involved in it

1 Expert Approved Answer
Step: 1 Unlock blur-text-image
Question Has Been Solved by an Expert!

Get step-by-step solutions from verified subject matter experts

Step: 2 Unlock
Step: 3 Unlock

Students Have Also Explored These Related General Management Questions!