

Question: Question 3 The comparative balance sheets for Gillen Inc. appear below: Dec 31, 20X7 Dec. 31, 20X6 $29,000 23,000 6,000 25,000 0 57,000 (18,000) $10,000
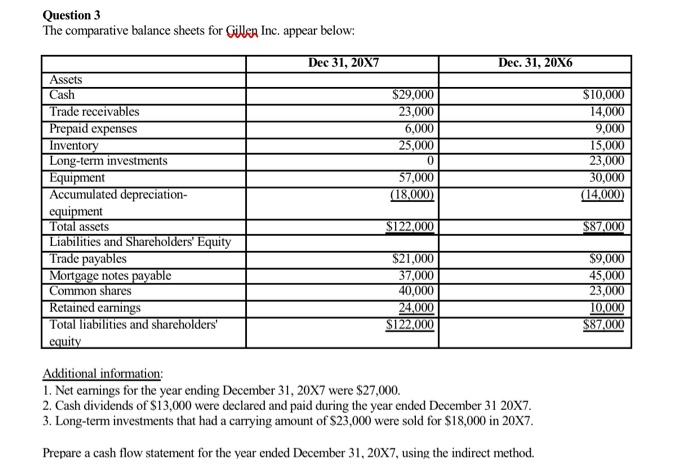
Question 3 The comparative balance sheets for Gillen Inc. appear below: Dec 31, 20X7 Dec. 31, 20X6 $29,000 23,000 6,000 25,000 0 57,000 (18,000) $10,000 14,000 9,000 15,000 23,000 30,000 (14.000) Assets Cash Trade receivables Prepaid expenses Inventory Long-term investments Equipment Accumulated depreciation- equipment Total assets Liabilities and Shareholders' Equity Trade payables Mortgage notes payable Common shares Retained earnings Total liabilities and shareholders' equity $122.000 $87,000 $21,000 37,000 40.000 24,000 S122.000 $9,000 45,000 23,000 10,000 $87.000 Additional information: 1. Net earnings for the year ending December 31, 20x7 were $27,000. 2. Cash dividends of $13,000 were declared and paid during the year ended December 31 20x7. 3. Long-term investments that had a carrying amount of $23,000 were sold for $18,000 in 20x7. Prepare a cash flow statement for the year ended December 31, 20X7, using the indirect method
Step by Step Solution
There are 3 Steps involved in it

Get step-by-step solutions from verified subject matter experts