

Question: Question 3 The problems below are based on the following demand and supply schedules for corn (all quantities are in millions of bushels per year).
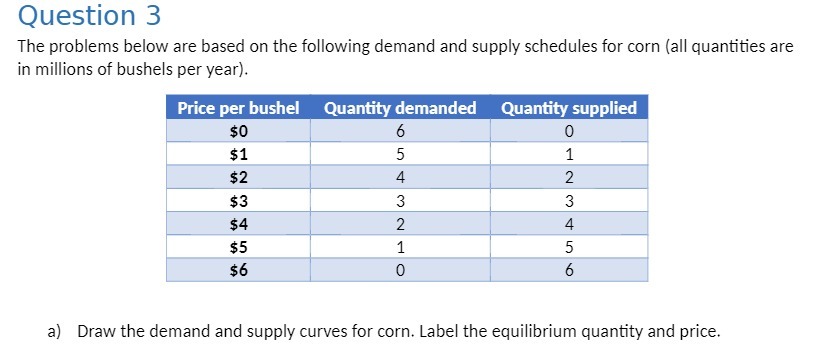
Question 3 The problems below are based on the following demand and supply schedules for corn (all quantities are in millions of bushels per year). Price per bushel Quantity demanded Quantity supplied $0 6 0 $1 5 $2 4 2 $3 $4 $5 $6 a) Draw the demand and supply curves for corn. Label the equilibrium quantity and price
Step by Step Solution
There are 3 Steps involved in it
1 Expert Approved Answer
Step: 1 Unlock

Question Has Been Solved by an Expert!
Get step-by-step solutions from verified subject matter experts
Step: 2 Unlock
Step: 3 Unlock