

Question: Question 3 with your instructor Ull Statistical Process Control a. Design an R- and an X-chart for this process X R Sample 9 44 1
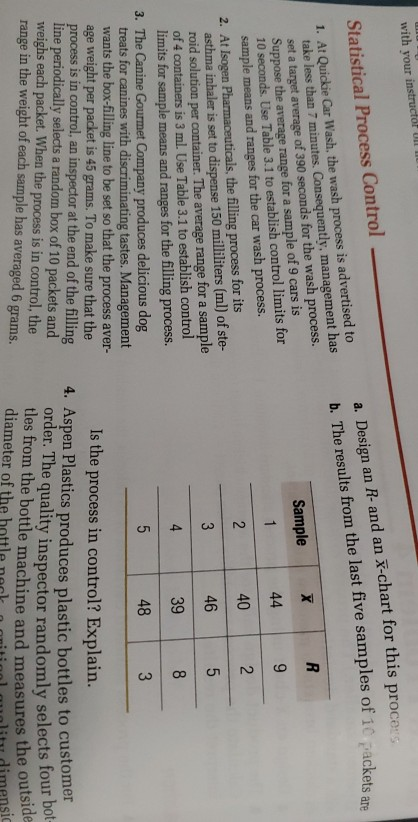
Question 3
with your instructor Ull Statistical Process Control a. Design an R- and an X-chart for this process X R Sample 9 44 1 40 2 2. 1. At Quickie Car Wash, the wash process is advertised to take less than 7 minutes. Consequently, management has set a target average of 390 seconds for the wash process. Suppose the average range for a sample of 9 cars is 10 seconds. Use Table 3.1 to establish control limits for sample means and ranges for the car wash process. 2. At Isogen Pharmaceuticals, the filling process for its asthma inhaler is set to dispense 150 milliliters (ml) of ste- roid solution per container. The average range for a sample of 4 containers is 3 ml. Use Table 3.1 to establish control limits for sample means and ranges for the filling process. 3. The Canine Gourmet Company produces delicious dog 3 46 5 4 39 8 5 48 3 treats for canines with discriminating tastes. Management wants the box-filling line to be set so that the process aver- age weight per packet is 45 grams. To make sure that the process is in control, an inspector at the end of the filling line periodically selects a random box of 10 packets and weighs each packet. When the process is in control, the range in the weight of each sample has averaged 6 grams. Is the process in control? Explain. 4. Aspen Plastics produces plastic bottles to customer order. The quality inspector randomly selects four bot- diameter of the b. The results from the last five samples of 10 packets are tles from the bottle machine and measures the outsideStep by Step Solution
There are 3 Steps involved in it
1 Expert Approved Answer
Step: 1 Unlock

Question Has Been Solved by an Expert!
Get step-by-step solutions from verified subject matter experts
Step: 2 Unlock
Step: 3 Unlock