

Question: Question 31 Using your favorite statistics software package, you generate a scatter plot with a regression equation and correlation coefficient. The regression equation is reported
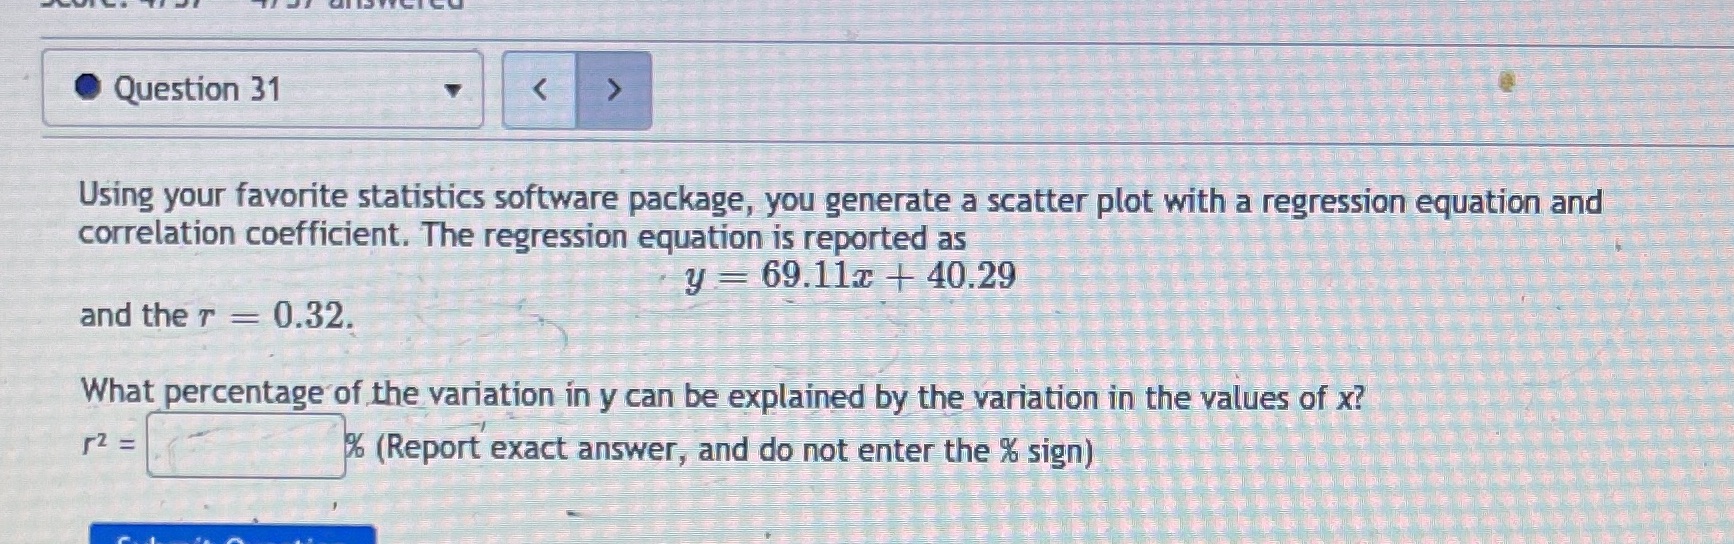
Question 31 Using your favorite statistics software package, you generate a scatter plot with a regression equation and correlation coefficient. The regression equation is reported as y = 69.11x + 40.29 and the T = 0.32. What percentage of the variation in y can be explained by the variation in the values of x? 12 = % (Report exact answer, and do not enter the % sign)
Step by Step Solution
There are 3 Steps involved in it
1 Expert Approved Answer
Step: 1 Unlock

Question Has Been Solved by an Expert!
Get step-by-step solutions from verified subject matter experts
Step: 2 Unlock
Step: 3 Unlock