

Question: Question 3.[9 Points]. Note on sample size calculations in estimating a population proportion. Suppose that we are interested to estimate the true proportion (p) of
![Question 3.[9 Points]. Note on sample size calculations in estimating a](https://s3.amazonaws.com/si.experts.images/answers/2024/06/66781dc1f2989_96966781dc1d0650.jpg)

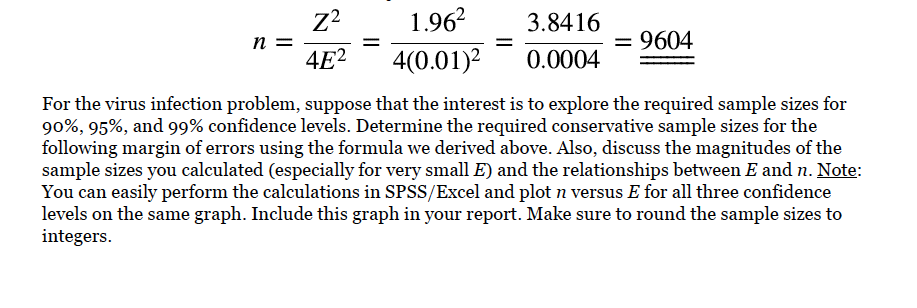
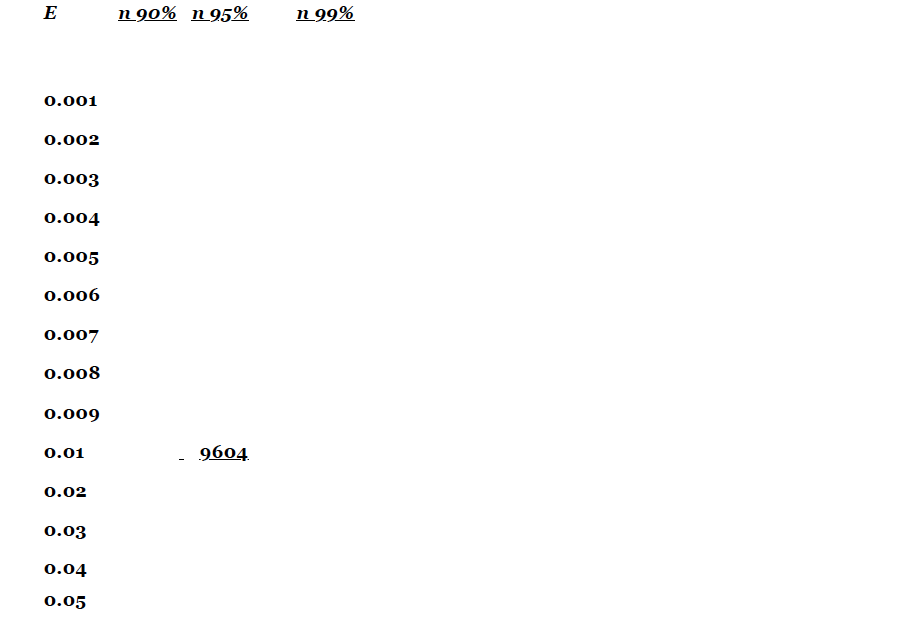
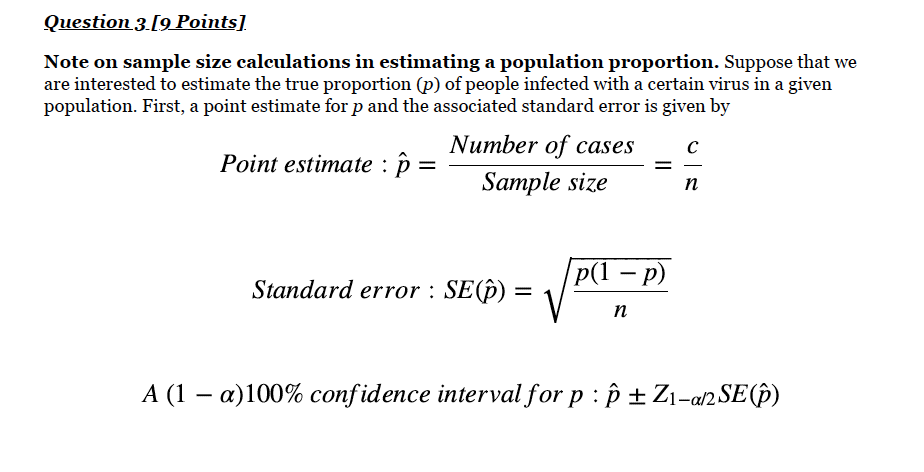
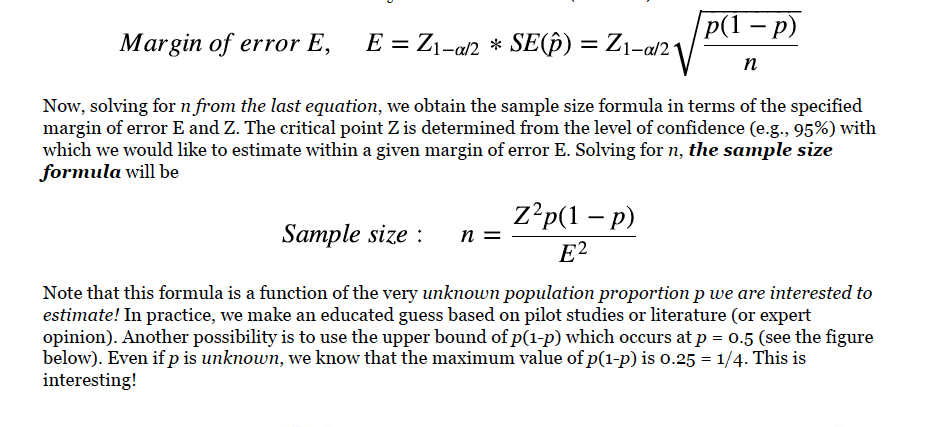
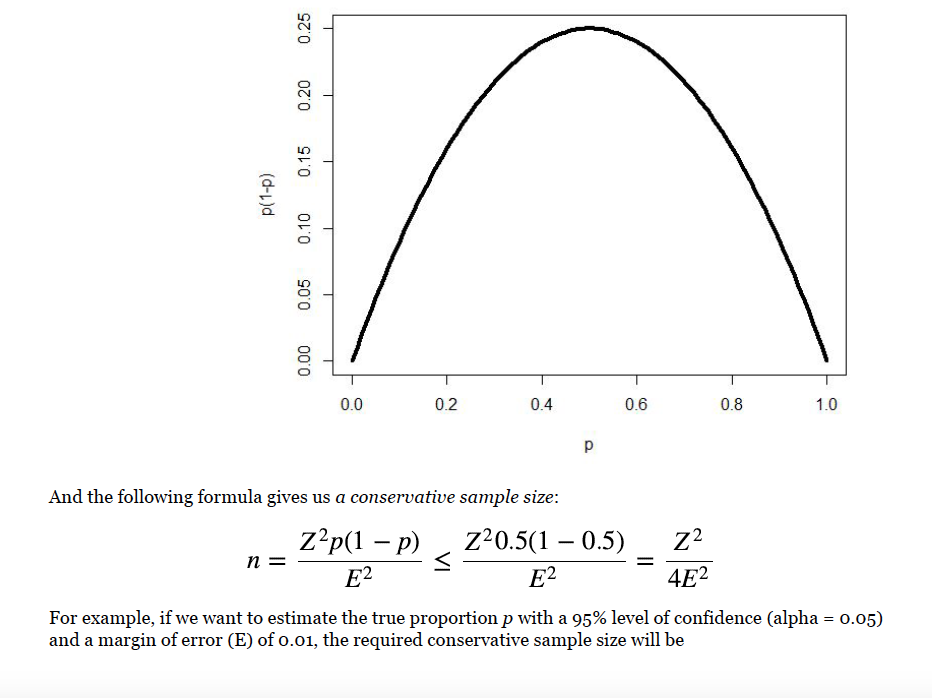


Question 3.[9 Points]. Note on sample size calculations in estimating a population proportion. Suppose that we are interested to estimate the true proportion (p) of people infected with a certain virus in a given population. First, a point estimate for p and the associated standard error is given by Number of cases Point estimate : p = Sample size n Standard error : SE(p) = p(1 - P) n A (1 - a) 100% confidence interval for p : p + Z1-a/2 SE(p)u 1 Margi of error E, E = 21.0\"? a: SE@) = 2H\0.25 0.10 0.15 0.20 p(1-p) 0.05 0.00 0.0 0.2 0.4 0.6 0.8 1.0 p And the following formula gives us a conservative sample size: Z2p(1 - p) _Z20.5(1 - 0.5) Z2 n = E2 E2 4E2 For example, if we want to estimate the true proportion p with a 95% level of confidence (alpha = 0.05) and a margin of error (E) of 0.01, the required conservative sample size will be22 _' 1.902 _ 3.8416 _9 4132 _ 400.01)2 _ 0.0004 _ : n: For the virus infection problem, suppose that the interest is to explore the required sample sizes for 90%, 95%, and 99% condence levels. Determine the required conservative sample sizes for the following margin of errors using the formula we derived above. Also, discuss the magnitudes of the sample sizes you calculated (especially for very small E) and the relationships between E and n. m: You can easily perform the calculations in SPSS/ Excel and plot :1 versus E for all three condence levels on the same graph. Include this graph in your report. Make sure to round the sample sizes to integers. E n1 90% n 95% n1 99% 0.001 0.002 0.003 0.004 0.005 0.006 0.007 0.008 0.009 0.01 9604 0.02 0.03 0.04 0.05
Step by Step Solution
There are 3 Steps involved in it

Get step-by-step solutions from verified subject matter experts