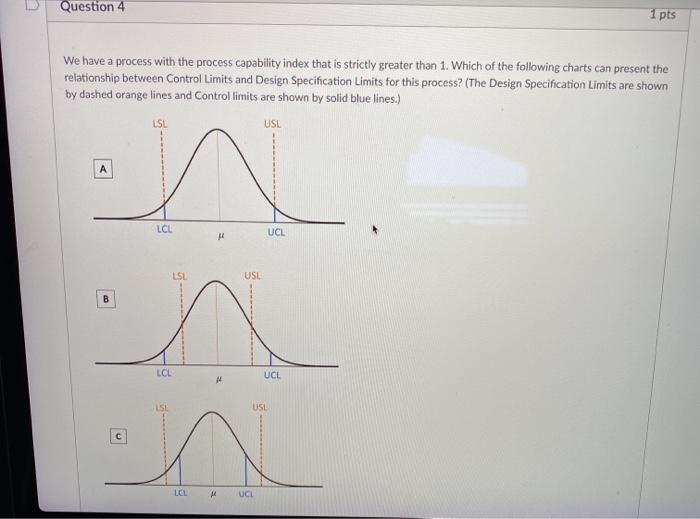
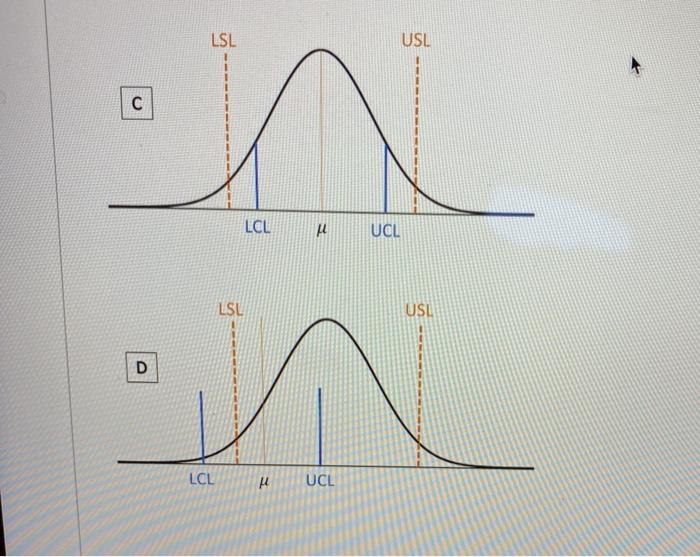
Question: Question 4 1 pts We have a process with the process capability index that is strictly greater than 1. Which of the following charts can

Question 4 1 pts We have a process with the
Question 4 1 pts We have a process with the process capability index that is strictly greater than 1. Which of the following charts can present the relationship between Control Limits and Design Specification Limits for this process? (The Design Specification Limits are shown by dashed orange lines and Control limits are shown by solid blue lines.) LSL USL n LCL UCL LSL USI B LCL UCL LSL USL n LCL A4 UCL LSL USL C LCL UCL LSU USL D LCL UCL

Step by Step Solution

There are 3 Steps involved in it

1 Expert Approved Answer
Step: 1 Unlock blur-text-image
Question Has Been Solved by an Expert!

Get step-by-step solutions from verified subject matter experts

Step: 2 Unlock
Step: 3 Unlock

Students Have Also Explored These Related General Management Questions!