

Question: Question: 4 [10 Marks) Based on the network diagram show in Figure 2 analyze the total paths, critical path, and float for each path if
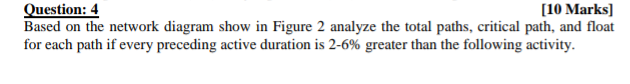
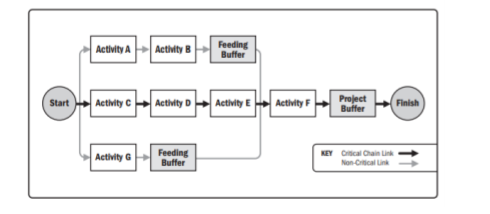
Question: 4 [10 Marks) Based on the network diagram show in Figure 2 analyze the total paths, critical path, and float for each path if every preceding active duration is 2-6% greater than the following activity. Activity Activity Feeding Buffer Start Activity Acthy D Activity Activity Project Buffer Finish Activity G Feeding Buffer KEY Otical Chain Link Non- Calunk
Step by Step Solution
There are 3 Steps involved in it
1 Expert Approved Answer
Step: 1 Unlock

Question Has Been Solved by an Expert!
Get step-by-step solutions from verified subject matter experts
Step: 2 Unlock
Step: 3 Unlock