

Question: Question 4 2.5 pts The data for this exam can be found here: Midterm 2 Dataset e Suppose that we want to conduct a 98%
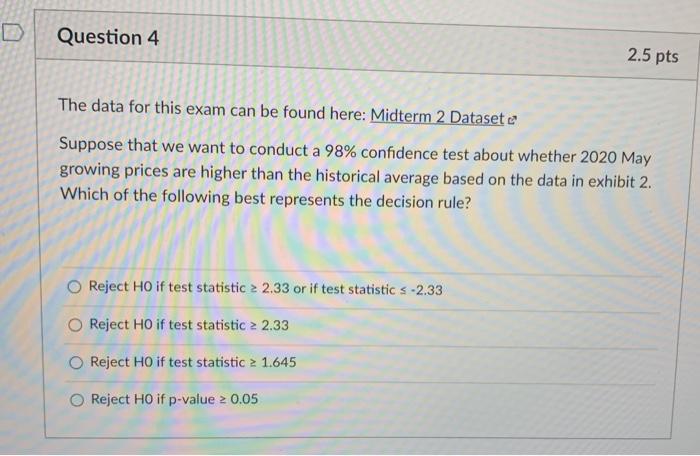
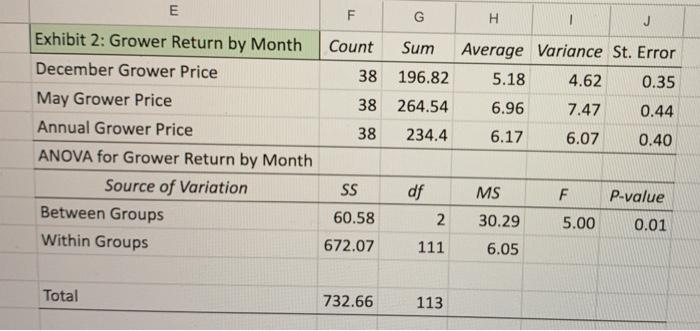
Question 4 2.5 pts The data for this exam can be found here: Midterm 2 Dataset e Suppose that we want to conduct a 98% confidence test about whether 2020 May growing prices are higher than the historical average based on the data in exhibit 2. Which of the following best represents the decision rule? Reject Ho if test statistic 2.33 or if test statistics -2.33 Reject HO if test statistic 2 2.33 Reject Ho if test statistic 2 1.645 O Reject HO if p-value 2 0.05 E G H 1 J Average Variance St. Error Count Sum 38 196.82 38 264.54 5.18 4.62 0.35 6.96 7.47 0.44 Exhibit 2: Grower Return by Month December Grower Price May Grower Price Annual Grower Price ANOVA for Grower Return by Month Source of Variation Between Groups Within Groups 38 234.4 6.17 6.07 0.40 SS df F MS 30.29 P-value 0.01 60.58 2 5.00 672.07 111 6.05 Total 732.66 113
Step by Step Solution
There are 3 Steps involved in it

Get step-by-step solutions from verified subject matter experts