

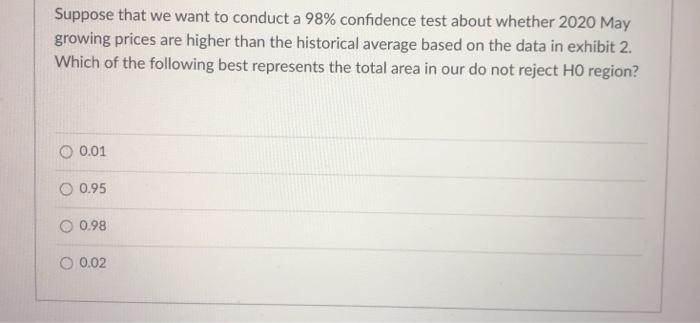
Question: use the data set to answer the question Suppose that we want to conduct a 98% confidence test about whether 2020 May growing prices are
 use the data set to answer the question
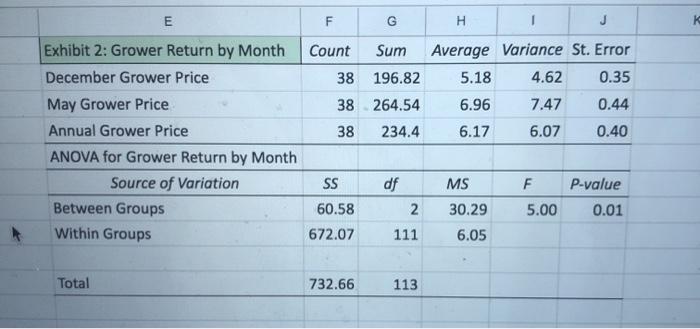
Suppose that we want to conduct a 98% confidence test about whether 2020 May growing prices are higher than the historical average based on the data in exhibit 2. Which of the following best represents the total area in our do not reject Ho region? 0 0.01 O 0.95 0.98 0 0.02 E F G . Count Sum 38 196.82 38 264.54 Average Variance St. Error 5.18 4.62 0.35 6.96 7.47 0.44 38 234.4 6.17 6.07 0.40 Exhibit 2: Grower Return by Month December Grower Price May Grower Price Annual Grower Price ANOVA for Grower Return by Month Source of Variation Between Groups Within Groups F SS 60.58 672.07 df 2 111 MS 30.29 P-value 0.01 5.00 6.05 Total 732.66 113
Step by Step Solution
There are 3 Steps involved in it

Get step-by-step solutions from verified subject matter experts