

Question: Question 4 5 1 pts A construction company is using PERT for a project with a critical path consisting of 7 activities and an expected
Question
pts
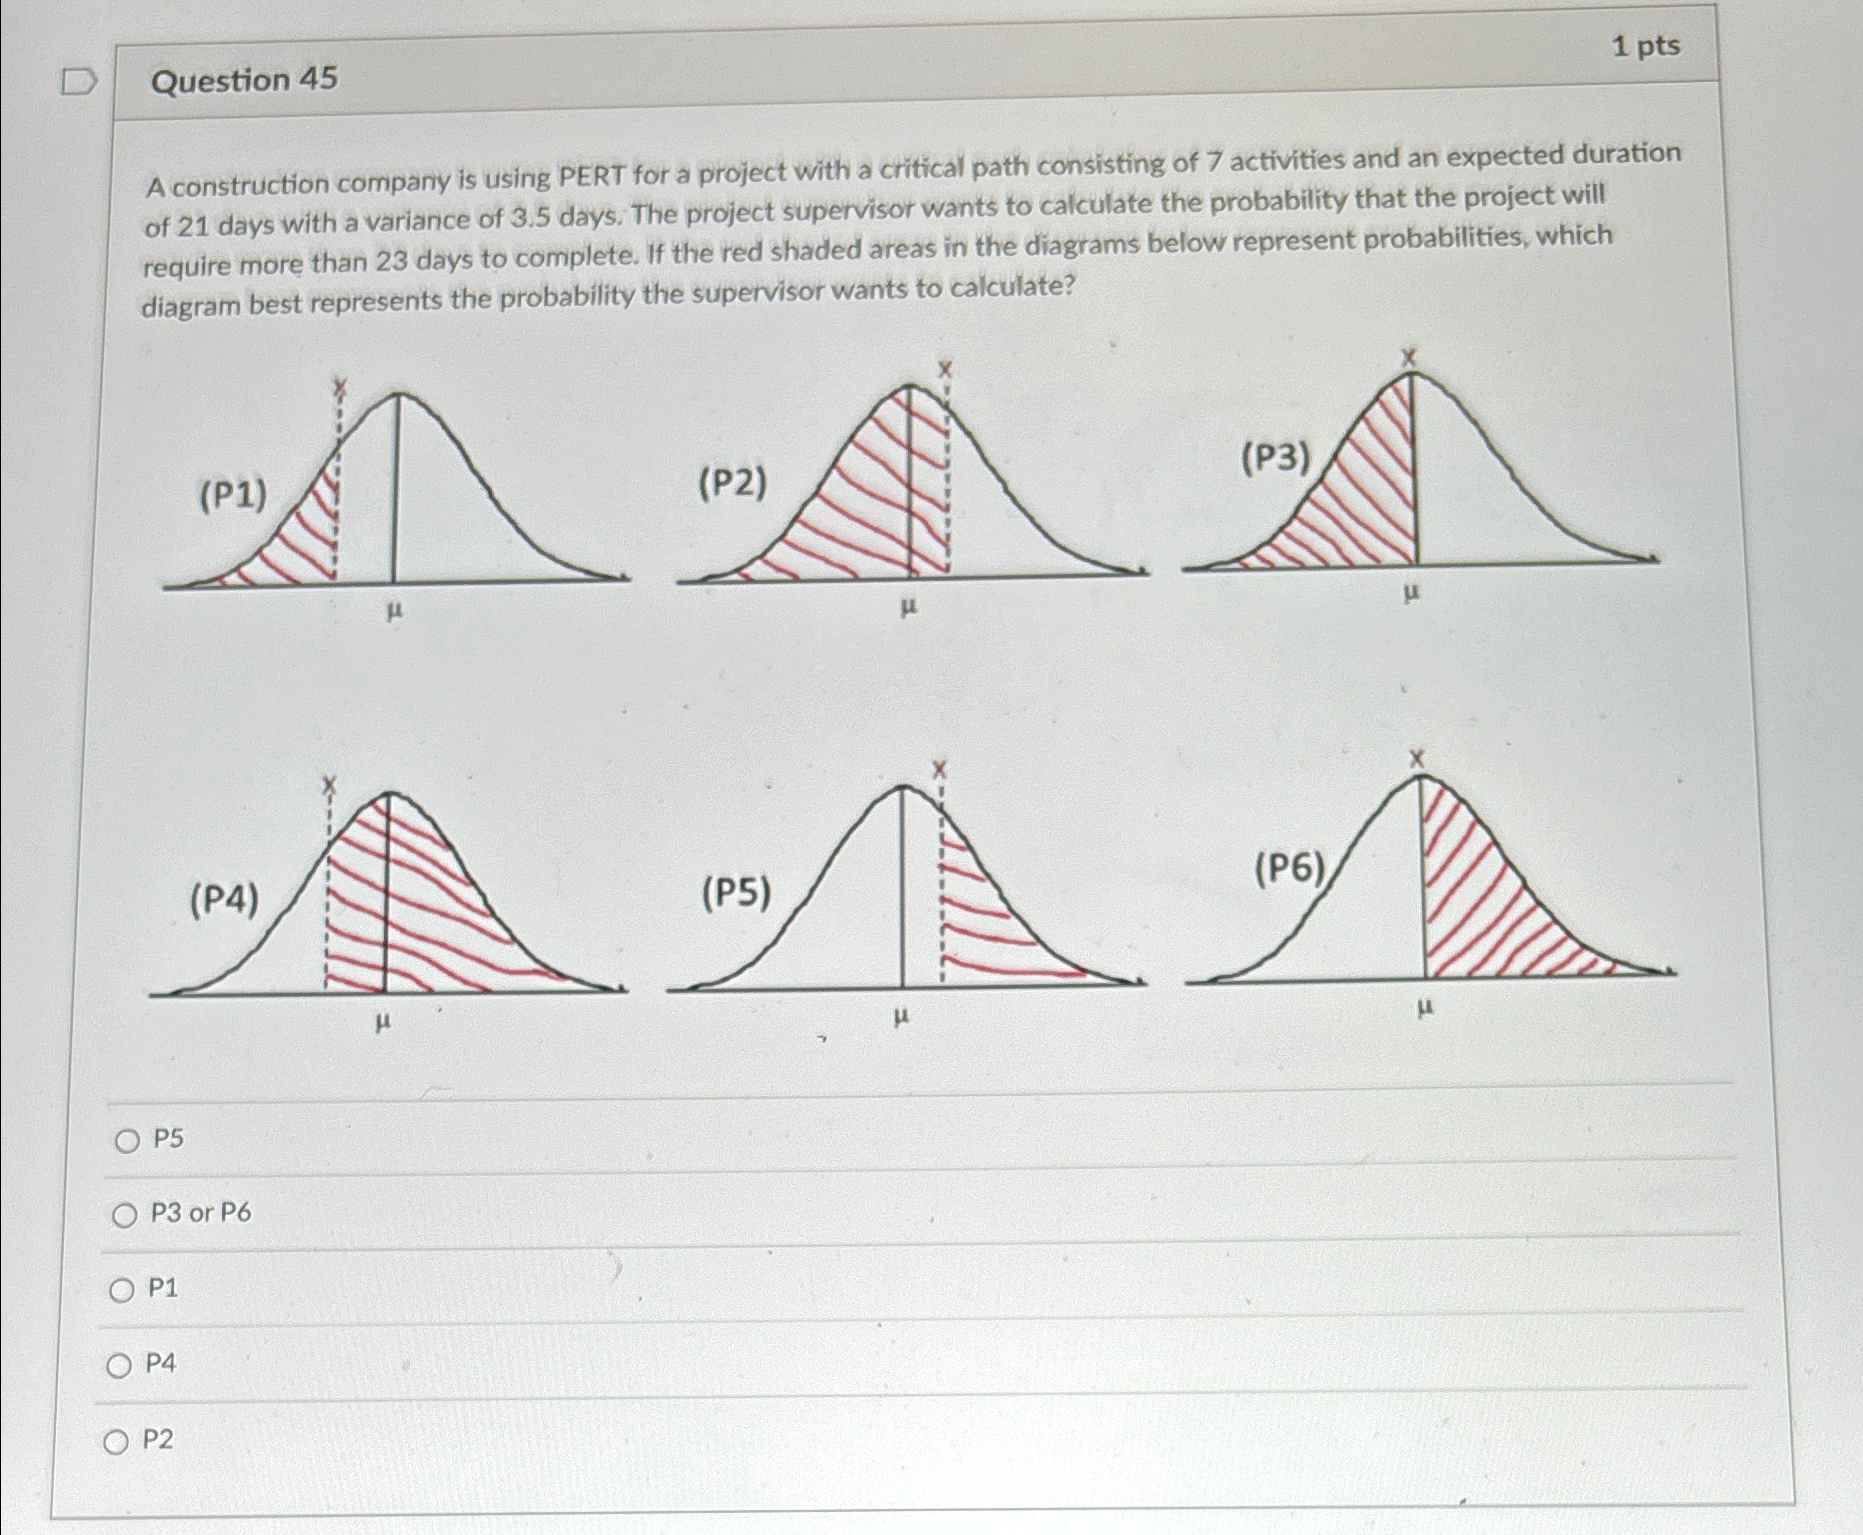
A construction company is using PERT for a project with a critical path consisting of activities and an expected duration of days with a variance of days. The project supervisor wants to calculate the probability that the project will require more than days to complete. If the red shaded areas in the diagrams below represent probabilities, which diagram best represents the probability the supervisor wants to calculate?
P
P or P
P
P
P
Step by Step Solution
There are 3 Steps involved in it
1 Expert Approved Answer
Step: 1 Unlock

Question Has Been Solved by an Expert!
Get step-by-step solutions from verified subject matter experts
Step: 2 Unlock
Step: 3 Unlock