

Question: Question 3 A construction company is using PERT for a project with a critical path consisting of 7 activities and an expected duration of
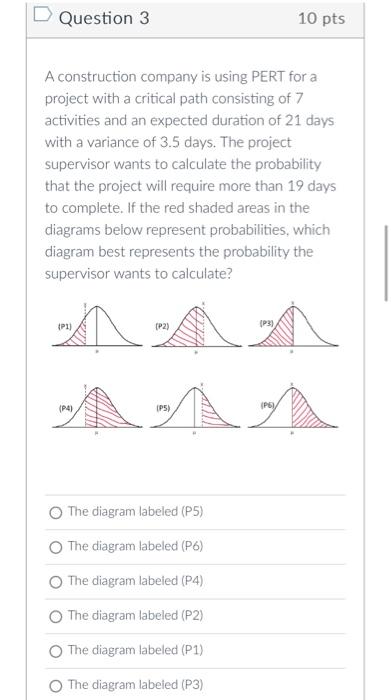
Question 3 A construction company is using PERT for a project with a critical path consisting of 7 activities and an expected duration of 21 days with a variance of 3.5 days. The project supervisor wants to calculate the probability that the project will require more than 19 days to complete. If the red shaded areas in the diagrams below represent probabilities, which diagram best represents the probability the supervisor wants to calculate? ^^^ (P2) (P1) (P4) (P5) The diagram labeled (P5) The diagram labeled (P6) The diagram labeled (P4) The diagram labeled (P2) The diagram labeled (P1) The diagram labeled (P3) 10 pts (P3) (P6)/
Step by Step Solution
There are 3 Steps involved in it
The detailed answer for the above question is provided below The question refers to a PERT Program Evaluation and Review Technique analysis which is o... View full answer

Get step-by-step solutions from verified subject matter experts