

Question: Question 4 (a) A monthly sales data between the years 1963 and 1972 is modelled using ARIMA(p, d, q)(P, D, Q)12. Several ARIMA models
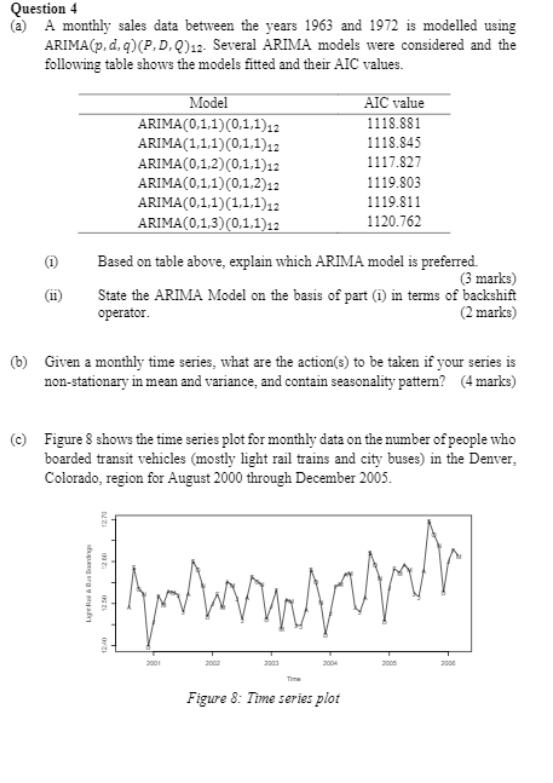
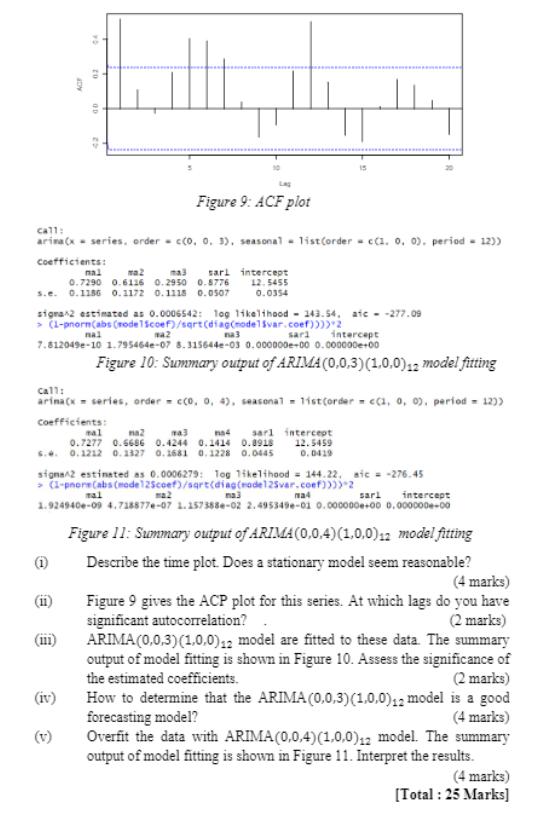
Question 4 (a) A monthly sales data between the years 1963 and 1972 is modelled using ARIMA(p, d, q)(P, D, Q)12. Several ARIMA models were considered and the following table shows the models fitted and their AIC values. Model AIC value 1118.881 ARIMA(0,1.1)(0,1,1)12 1118.845 ARIMA(1,1.1)(0,1.1)12 ARIMA(0,1,2)(0,1,1)12 ARIMA(0.1,1)(0,1,2)12 ARIMA(0,1.1)(1,1,1)12 ARIMA(0,1,3)(0,1.1)12 1117.827 1119.803 1119.811 1120.762 Based on table above, explain which ARIMA model is preferred. (3 marks) State the ARIMA Model on the basis of part (i) in terms of backshift (2 marks) operator. (b) Given a monthly time series, what are the action(s) to be taken if your series is non-stationary in mean and variance, and contain seasonality patten? (4 marks) (c) Figure 8 shows the time series plot for monthly data on the number of people who boarded transit vehicles (mostly light rail trains and city buses) in the Denver, Colorado, region for August 2000 through December 2005. 2001 2003 2004 200n 200 Time Figure 8: Time series plot g era a Figure 9: ACF plot call: arina(x- series, order - cco, 0. 3), seasonal - list(order - c(1. 0, o). period - 12)) Coeftictents: sarl intercept 12. 5455 nal ma2 ma 0.7290 0.6116 0. 2950 0.S776 s.e. 0.1186 0.1172 0.1118 0.0507 0.0354 sigra2 estimated as 0.0006542: log 1ikelihood - 143.54, atc - -277.09 na3 7.812049e-10 1.795464e-07 8.315644e-03 0.000000e-00 0.00000e-00 > (1-pnorn(abs (nodelscoef)/sqrt (diag(nodelsvar.coef))))"2 sari nal ma2 intercept Figure 10: Summary output of ARIMA (0,0,3)(1.0.0)12 model fiting Call: arina(x = series, order - cco, o, 4), seasonal - 11stcorder - ca, 0, 0), period - 12)) Coefficients: nal na3 0.7277 0.6686 0.4244 0.1414 0.0918 s.. 0.1212 0. 1327 0. 1681 0. 1228 0.0445 na2 sarl intercept 12.5459 na4 0. 0419 signan2 estinated as 0.0006279: Tog 1ikelihaod = 144.22. sic = -276.45 > (1-pnere(abs (mede125coef)/sqrt(diag(rode125var.coef)))) 2 nal 1.924940e-09 4.718877e-07 1.15738se-02 2.495349e-01i 0.000000e-00 0.000000e-00 nal ma2 ma4 sarl intercept Figure 11: Summary output of ARIMA(0,0.4)(1,0.0)12 model fitting (1) Describe the time plot. Does a stationary model seem reasonable? (4 marks) Figure 9 gives the ACP plot for this series. At which lags do you have (2 marks) ARIMA(0,0,3)(1.0.0)12 model are fitted to these data. The summary output of model fitting is shown in Figure 10. Assess the significance of (2 marks) How to determine that the ARIMA (0,0.3)(1.0.0)42 model is a good (4 marks) Overfit the data with ARIMA (0,0,4)(1,0,0)12 model. The summary output of model fitting is shown in Figure 11. Interpret the results. (4 marks) [Total : 25 Marks] (ii) significant autocorrelation? (ii) the estimated coefficients. (iv) forecasting model? (v)
Step by Step Solution
3.30 Rating (147 Votes )
There are 3 Steps involved in it
1 Based on table above explain which ARIMA model is preferred The ARIMA model that is preferred is the ARIMA 11101112 model as it has the lowest AIC value at 1117827 The AIC value is used to compare d... View full answer

Get step-by-step solutions from verified subject matter experts