

Question: QUESTION 4 Estimate the population regression model: TestScore =B 3 2=B+B STR+Income +Lunch+ Income? + B Income?+u, 3 i i 1 i where E[u
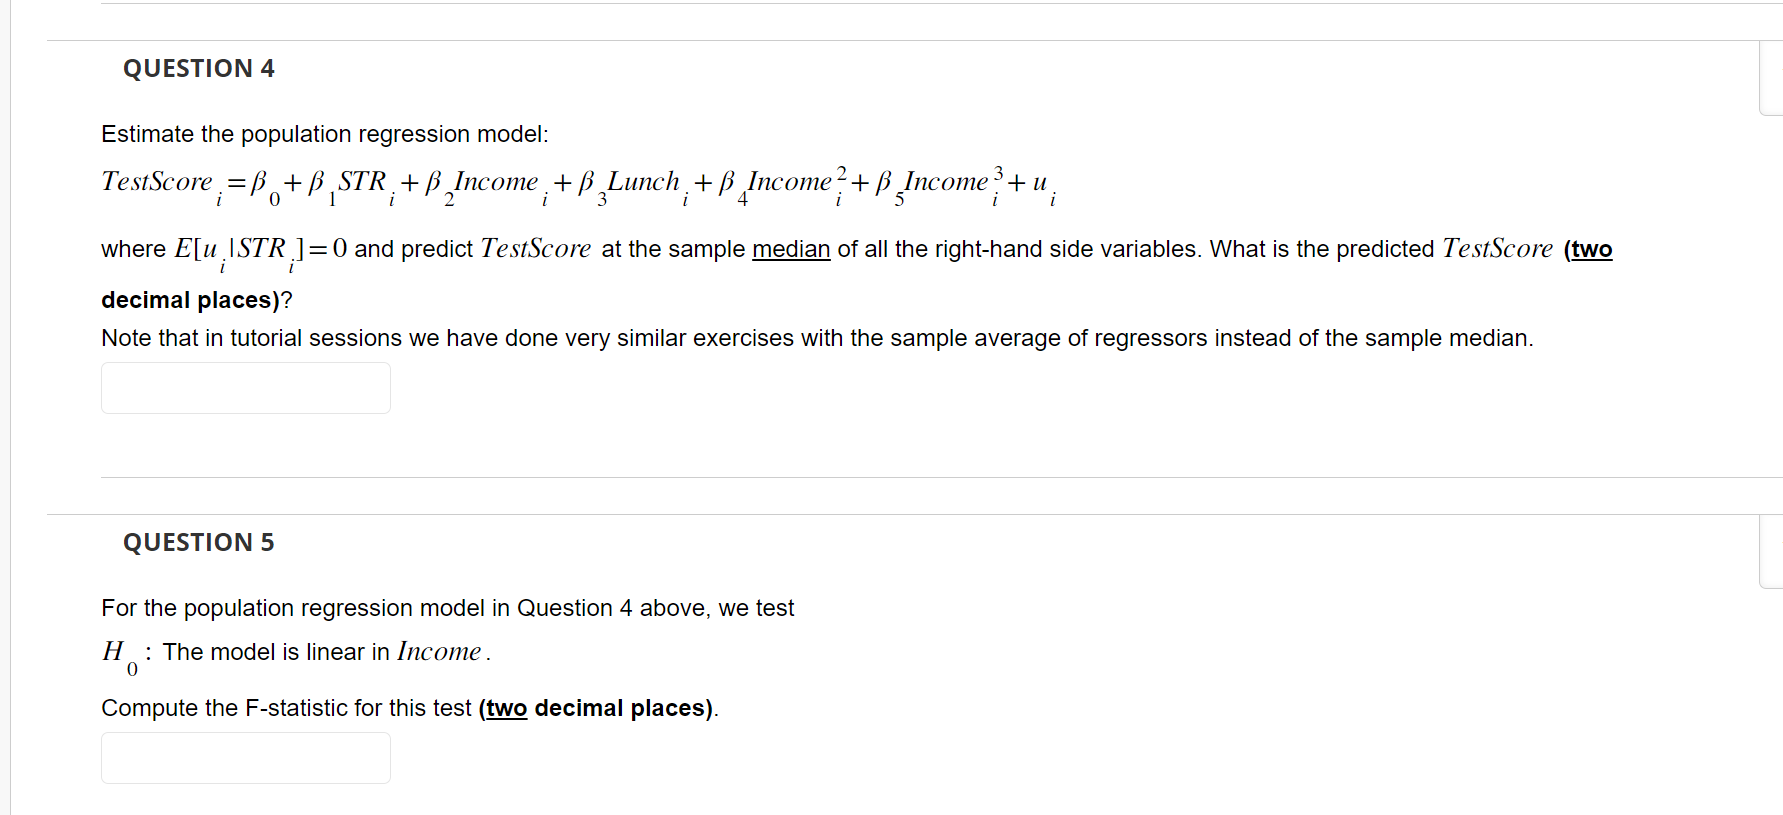
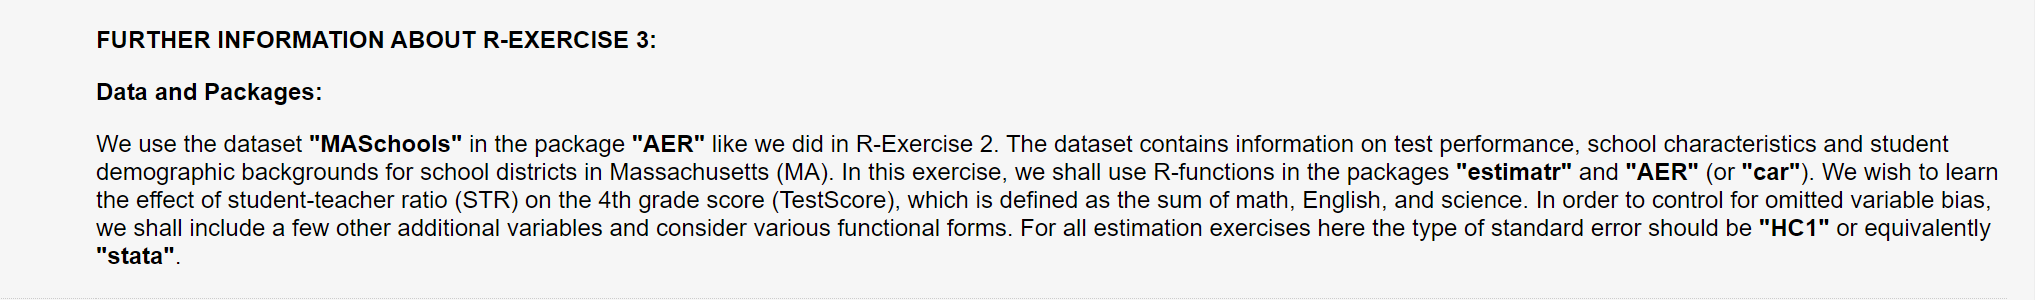
QUESTION 4 Estimate the population regression model: TestScore =B 3 2=B+B STR+Income +Lunch+ Income? + B Income?+u, 3 i i 1 i where E[u ISTR]=0 and predict TestScore at the sample median of all the right-hand side variables. What is the predicted TestScore (two decimal places)? Note that in tutorial sessions we have done very similar exercises with the sample average of regressors instead of the sample median. QUESTION 5 For the population regression model in Question 4 above, we test H: The model is linear in Income. 0 Compute the F-statistic for this test (two decimal places). FURTHER INFORMATION ABOUT R-EXERCISE 3: Data and Packages: We use the dataset "MASchools" in the package "AER" like we did in R-Exercise 2. The dataset contains information on test performance, school characteristics and student demographic backgrounds for school districts in Massachusetts (MA). In this exercise, we shall use R-functions in the packages "estimate" and "AER" (or "car"). We wish to learn the effect of student-teacher ratio (STR) on the 4th grade score (TestScore), which is defined as the sum of math, English, and science. In order to control for omitted variable bias, we shall include a few other additional variables and consider various functional forms. For all estimation exercises here the type of standard error should be "HC1" or equivalently "stata".
Step by Step Solution
There are 3 Steps involved in it

Get step-by-step solutions from verified subject matter experts