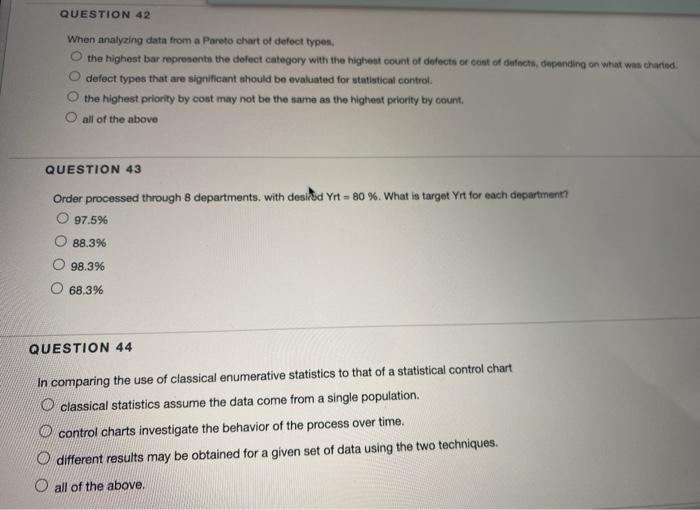
Question: QUESTION 42 When analyzing data from a Pareto chart of defect types, O the highest bar represents the defect category with the highest count of

QUESTION 42 When analyzing data from a Pareto
QUESTION 42 When analyzing data from a Pareto chart of defect types, O the highest bar represents the defect category with the highest count of defects or cost of defects, depending on what was charted defect types that are significant should be evaluated for statistical control the highest priority by cont may not be the same as the highest priority by count. O all of the above QUESTION 43 Order processed through 8 departments, with desildid Ynt = 80 %. What is target Yrt for each department? 97.5% 88.396 98.3% 68.3% QUESTION 44 In comparing the use of classical enumerative statistics to that of a statistical control chart O classical statistics assume the data come from a single population. O control charts investigate the behavior of the process over time. O different results may be obtained for a given set of data using the two techniques. all of the above

Step by Step Solution

There are 3 Steps involved in it

1 Expert Approved Answer
Step: 1 Unlock blur-text-image
Question Has Been Solved by an Expert!

Get step-by-step solutions from verified subject matter experts

Step: 2 Unlock
Step: 3 Unlock

Students Have Also Explored These Related General Management Questions!