

Question: Question 43 4 pts Table 5.11 Factors for Calculating Three-Sigma Limits for the i Chart and R-Chart Factor for UCL for R-Charts D4 minu Factor
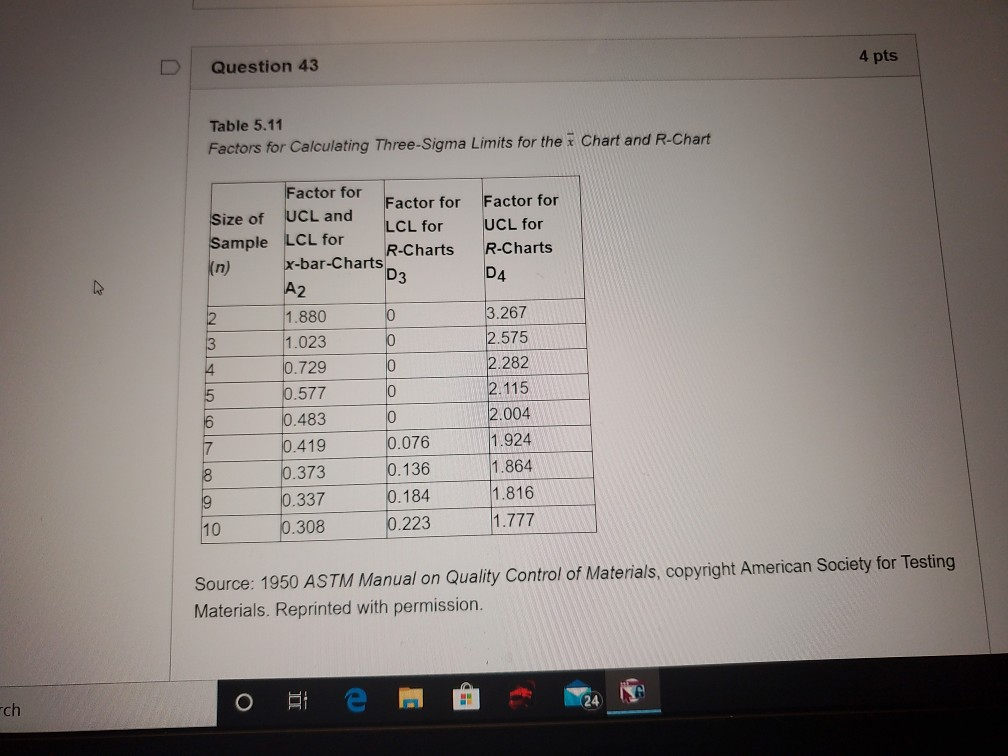
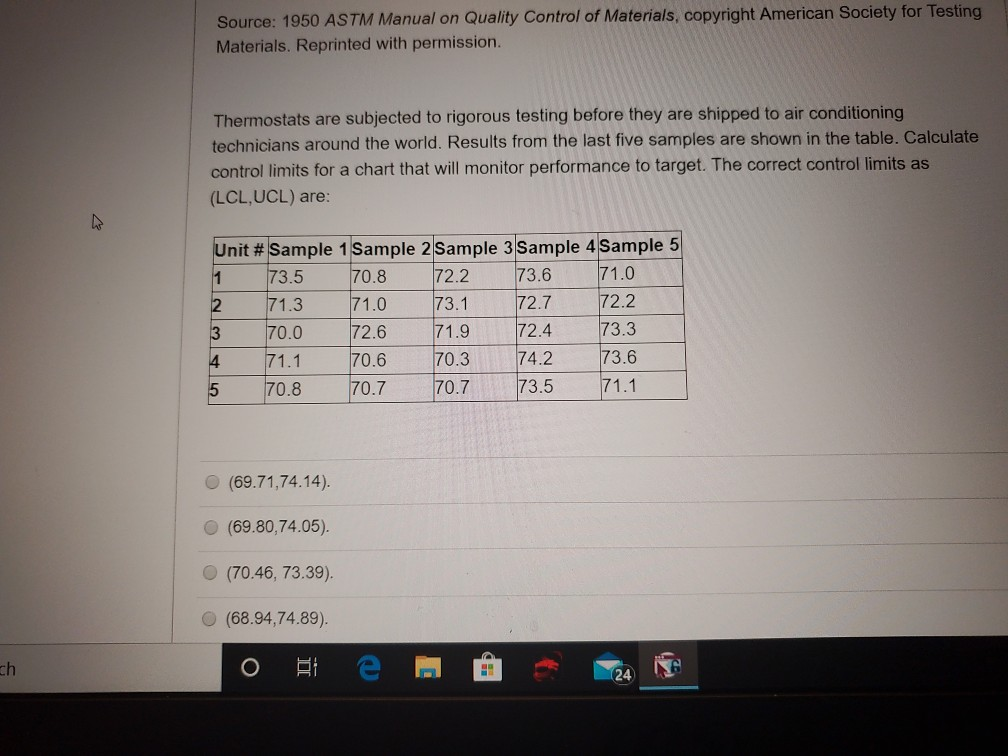
Question 43 4 pts Table 5.11 Factors for Calculating Three-Sigma Limits for the i Chart and R-Chart Factor for UCL for R-Charts D4 minu Factor for Factor for Size of UCL and LCL for Sample LCL for R-Charts x-bar-Charts A2 2 1.8800 1.023 0.729 0.577 0.483 0.419 0.076 0.373 0.136 0.337 0.184 0.308 0.223 oooo 3.267 2.575 2.282 2.115 2.004 1.924 1.864 1.816 1.777 Source: 1950 ASTM Manual on Quality Control of Materials, copyright American Society for Testing Materials. Reprinted with permission. Source: 1950 ASTM Manual on Quality Control of Materials, copyright American Society for lesting Materials. Reprinted with permission. Thermostats are subjected to rigorous testing before they are shipped to air conditioning technicians around the world. Results from the last five samples are shown in the table. Calculate control limits for a chart that will monitor performance to target. The correct control limits as (LCL,UCL) are: 72.2 Unit # Sample 1 Sample 2 Sample 3 Sample 4 Sample 5 73.5 70.8 73.6 71.0 2 71.3 71.0 73.1 12.7 12.2 70.0 72.6 71.9 72.4 71.1 70.6 70.3 74.2 73.6 5 70.8 70.7 70.7 73.5 71.1 73.3 (69.71,74.14). (69.80,74.05). (70.46, 73.39) (68.94,74.89)
Step by Step Solution
There are 3 Steps involved in it
1 Expert Approved Answer
Step: 1 Unlock

Question Has Been Solved by an Expert!
Get step-by-step solutions from verified subject matter experts
Step: 2 Unlock
Step: 3 Unlock