

Question: Question 5 A sample of 5 boxes was selected from a process each day for 12 days. The weight of each box (in ounces), along
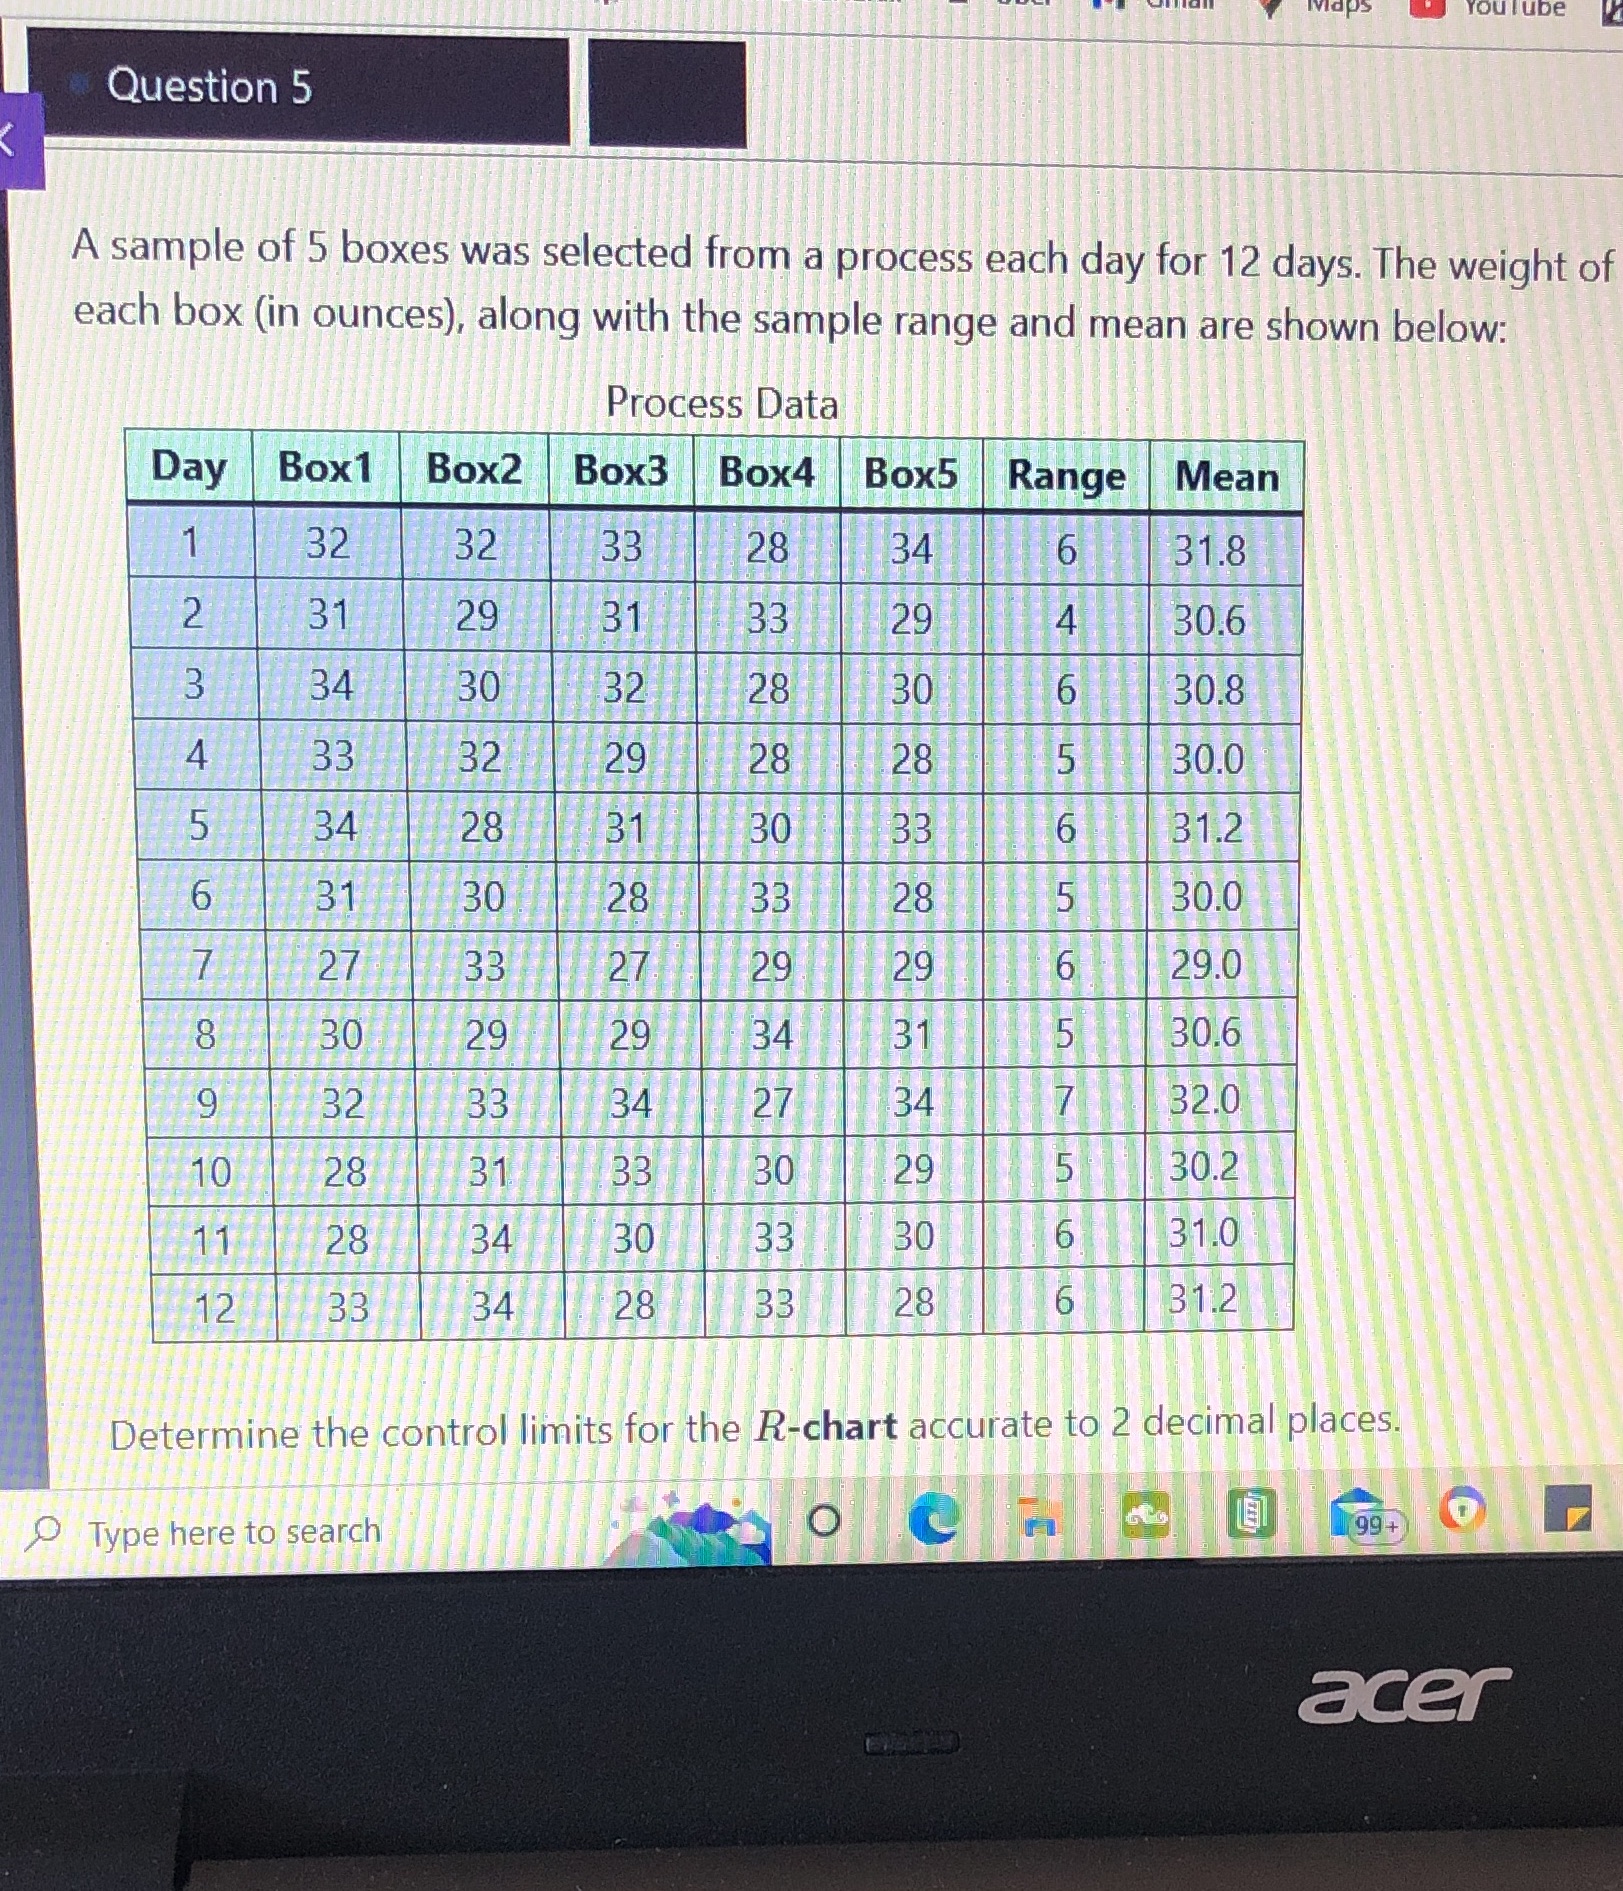

Question 5 A sample of 5 boxes was selected from a process each day for 12 days. The weight of each box (in ounces), along with the sample range and mean are shown below: Process Data Day Box 1 Box2 Box3 Box4 Box5 Range Mean 32 32 33 28 34 6 31.8 2 31 29 31 33 29 4 30.6 3 34 30 32 28 30 6 30.8 4 33 32 29 28 28 5 30.0 5 34 28 31 30 33 6 31.2 6 31 30 28 33 28 5 30.0 27 33 27 29 29 6 29.0 8 30 29 29 34 31 5 30.6 9 32 33 34 27 34 7 32.0 10 28 31 33 30 29 5 30.2 11 28 34 30 33 30 6 31.0 12 33 34 28 33 28 6 31.2 Determine the control limits for the R-chart accurate to 2 decimal places. Type here to search O 99+ acer
Step by Step Solution
There are 3 Steps involved in it
1 Expert Approved Answer
Step: 1 Unlock

Question Has Been Solved by an Expert!
Get step-by-step solutions from verified subject matter experts
Step: 2 Unlock
Step: 3 Unlock