

Question: Question 5 a) You have been given the return data shown in the first table on three assets - F, G and H-over the period
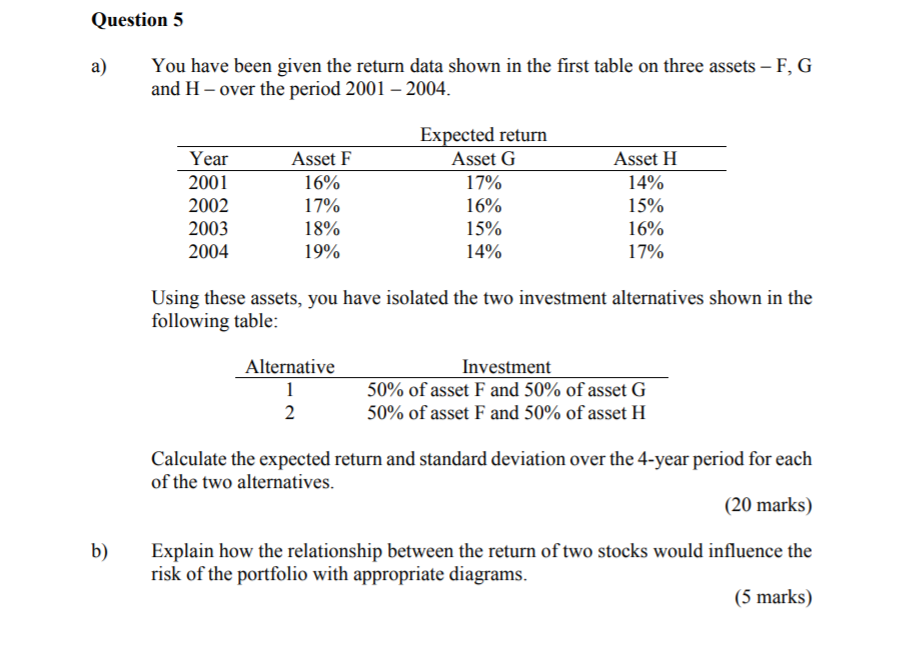
Question 5 a) You have been given the return data shown in the first table on three assets - F, G and H-over the period 2001 - 2004. Expected return Asset G 17% Year 2001 2002 2003 2004 Asset F 16% 17% 18% 19% 16% Asset H 14% 15% 16% 17% 15% 14% Using these assets, you have isolated the two investment alternatives shown in the following table: Alternative Investment 50% of asset F and 50% of asset G 50% of asset F and 50% of asset H Calculate the expected return and standard deviation over the 4-year period for each of the two alternatives. (20 marks) b) Explain how the relationship between the return of two stocks would influence the risk of the portfolio with appropriate diagrams. (5 marks) Question 5 a) You have been given the return data shown in the first table on three assets - F, G and H-over the period 2001 - 2004. Expected return Asset G 17% Year 2001 2002 2003 2004 Asset F 16% 17% 18% 19% 16% Asset H 14% 15% 16% 17% 15% 14% Using these assets, you have isolated the two investment alternatives shown in the following table: Alternative Investment 50% of asset F and 50% of asset G 50% of asset F and 50% of asset H Calculate the expected return and standard deviation over the 4-year period for each of the two alternatives. (20 marks) b) Explain how the relationship between the return of two stocks would influence the risk of the portfolio with appropriate diagrams
Step by Step Solution
There are 3 Steps involved in it

Get step-by-step solutions from verified subject matter experts