

Question: Question 5?? Optimizing Inventory and Maximizing Profits at Revolution Bikes Revolution Bikes keeps an inventory of high-quality bike frames on hand for all their custom

Question 5??
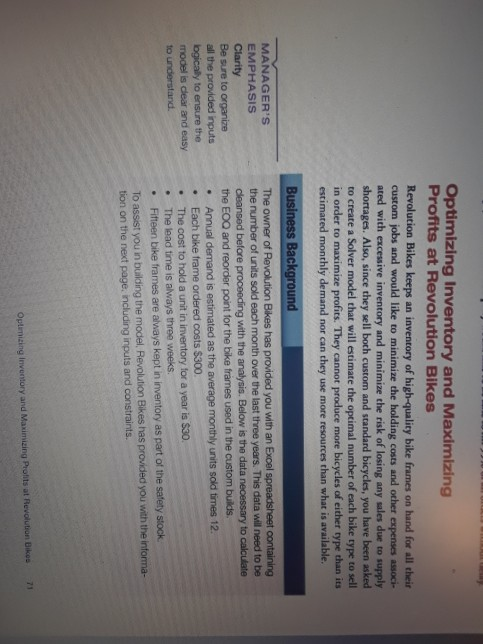
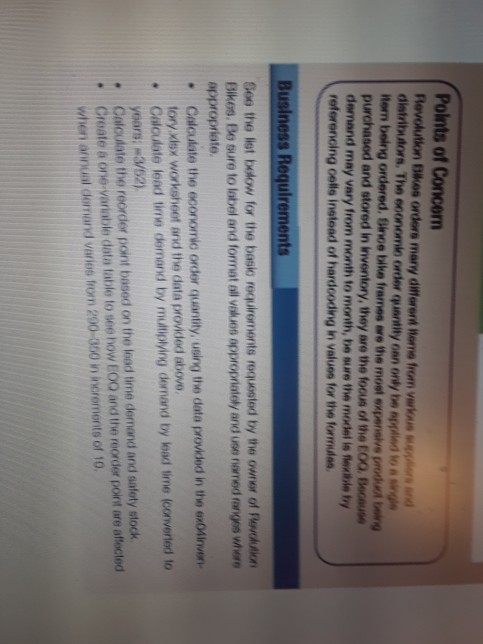
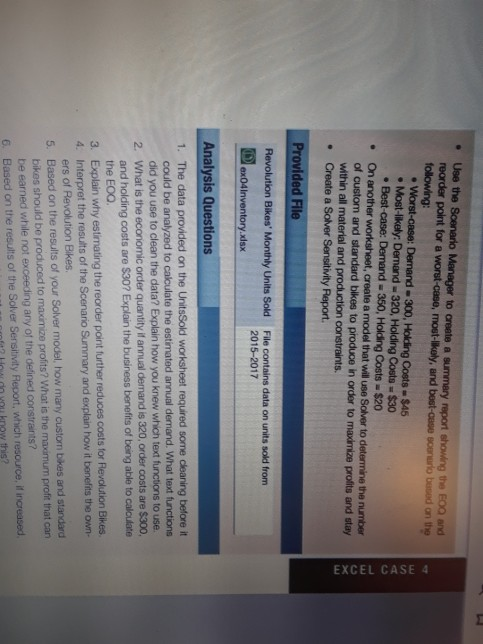
Optimizing Inventory and Maximizing Profits at Revolution Bikes Revolution Bikes keeps an inventory of high-quality bike frames on hand for all their custom jobs and would like to minimize the holding costs and other expenses associ- ated with excessive inventory and minimize the risk of losing any sales due to supply in order to maximize profits. They cannot produce more bicycles of either type than its MANAGER'S EMPHASIS The owner of Revolution Bikes has you with an Excel the EOQ and reorder point for the bike frames used in the custom builds. . Annual demand is estimated as the average monthly units sold times 12. . Each bike frame ordered costs $300 nputs . The lead time is always three weeks. bike frames are aways kept in inventory as part of the safety stock To assist you in building the model., Revolution Bikes has provided you with the informa- and Blike Frames $12.10 (cost per oz.) 0z $0.75 $1.10 $0.30 Plastic (cost per oz.) rces Needed per Bike in 15 Aluminum (oz.) Steel (oz.) 10 Frames Aluminum (oz.) Steel (oz.) Plastic (oz.) 325 60 400 300 350 27 40 Max Demand for Standard Bikes Polnts of Concern distributors. The eoonomlo order qunnitity iten being ordered. Sinoe bike frames are the most expenisive produd teig purchased and stored in inventory, they are the focus of the O0 Because demand may vary from month to month, be sure the model is lexible bhy referencing cells instead of hardooding in values for the formulas oan only be opplied to a singe Business Requirements Geo the list bolow for the basiko requirements requesteod by the ouner of Revclution Bikes. Be sure to label and format all vakuos oppropriately and use named ranges where oppropriate. Calculate the economic order quantity, using the data provwdled in the sx0Alrven- tory xisx worksheet and the data provided abovo . Calculate lead time demand by multiplying demand by load time (converted to Calculate the reorder point based on the lead time demand and safety stock Create a one-variabls data table to see how EOO and the reorder point are affected when annual dornand varies from 290-350 in increments of 10, . . Manager to create a summary report showing the E0Q and reorder point for a worst-case, most-likely, and best-case soenurio based on the e Worst-case: Demand- 300, Holding Costs $45 . Most-likely: Demand 320, Holding Costs $30 . Best-case: Demand 350, Holding Costs $20 . On another te a model that will use Solver to detemine the number of custom and standard bikes to produce in order to maximize prolfits and stay within all material and production constraints . Create a Solver Sensitivity Report ovided File Revolution Bikes' Monthly Units Sold File contains data on units sold from 2015-2017 ex04Inventory xisx Analysis Questions 1. The data provided on the UnitsSold worksheet required some cleaning before it could be analyzed to calculate the estimated annual demand. What text functions did you use to clean the data? Explain how you knew which text functions to use. 2. What is the economic order quantity if annual demand is 320, order costs are $300 and holding costs are $30? Explain the business benefits of being able to calculate the EO0. 3. Explain why estimating the reorder point further reduces costs for Revolution Bikes et the results of the Scenario Summary and explain how it benefits the own- 4. Interpr 5. Based on the results of your Solver model, how many custom bikes and standard bikes should be produced to maximize profits? What is the maximum proft that can ers of Revolution Bikes be earned while not exceeding any of the defined constraints? 6. Based on the results of the Solver Sensitivity Report, which resource, if increased Optimizing Inventory and Maximizing Profits at Revolution Bikes Revolution Bikes keeps an inventory of high-quality bike frames on hand for all their custom jobs and would like to minimize the holding costs and other expenses associ- ated with excessive inventory and minimize the risk of losing any sales due to supply in order to maximize profits. They cannot produce more bicycles of either type than its MANAGER'S EMPHASIS The owner of Revolution Bikes has you with an Excel the EOQ and reorder point for the bike frames used in the custom builds. . Annual demand is estimated as the average monthly units sold times 12. . Each bike frame ordered costs $300 nputs . The lead time is always three weeks. bike frames are aways kept in inventory as part of the safety stock To assist you in building the model., Revolution Bikes has provided you with the informa- and Blike Frames $12.10 (cost per oz.) 0z $0.75 $1.10 $0.30 Plastic (cost per oz.) rces Needed per Bike in 15 Aluminum (oz.) Steel (oz.) 10 Frames Aluminum (oz.) Steel (oz.) Plastic (oz.) 325 60 400 300 350 27 40 Max Demand for Standard Bikes Polnts of Concern distributors. The eoonomlo order qunnitity iten being ordered. Sinoe bike frames are the most expenisive produd teig purchased and stored in inventory, they are the focus of the O0 Because demand may vary from month to month, be sure the model is lexible bhy referencing cells instead of hardooding in values for the formulas oan only be opplied to a singe Business Requirements Geo the list bolow for the basiko requirements requesteod by the ouner of Revclution Bikes. Be sure to label and format all vakuos oppropriately and use named ranges where oppropriate. Calculate the economic order quantity, using the data provwdled in the sx0Alrven- tory xisx worksheet and the data provided abovo . Calculate lead time demand by multiplying demand by load time (converted to Calculate the reorder point based on the lead time demand and safety stock Create a one-variabls data table to see how EOO and the reorder point are affected when annual dornand varies from 290-350 in increments of 10, . . Manager to create a summary report showing the E0Q and reorder point for a worst-case, most-likely, and best-case soenurio based on the e Worst-case: Demand- 300, Holding Costs $45 . Most-likely: Demand 320, Holding Costs $30 . Best-case: Demand 350, Holding Costs $20 . On another te a model that will use Solver to detemine the number of custom and standard bikes to produce in order to maximize prolfits and stay within all material and production constraints . Create a Solver Sensitivity Report ovided File Revolution Bikes' Monthly Units Sold File contains data on units sold from 2015-2017 ex04Inventory xisx Analysis Questions 1. The data provided on the UnitsSold worksheet required some cleaning before it could be analyzed to calculate the estimated annual demand. What text functions did you use to clean the data? Explain how you knew which text functions to use. 2. What is the economic order quantity if annual demand is 320, order costs are $300 and holding costs are $30? Explain the business benefits of being able to calculate the EO0. 3. Explain why estimating the reorder point further reduces costs for Revolution Bikes et the results of the Scenario Summary and explain how it benefits the own- 4. Interpr 5. Based on the results of your Solver model, how many custom bikes and standard bikes should be produced to maximize profits? What is the maximum proft that can ers of Revolution Bikes be earned while not exceeding any of the defined constraints? 6. Based on the results of the Solver Sensitivity Report, which resource, if increased
Step by Step Solution
There are 3 Steps involved in it

Get step-by-step solutions from verified subject matter experts