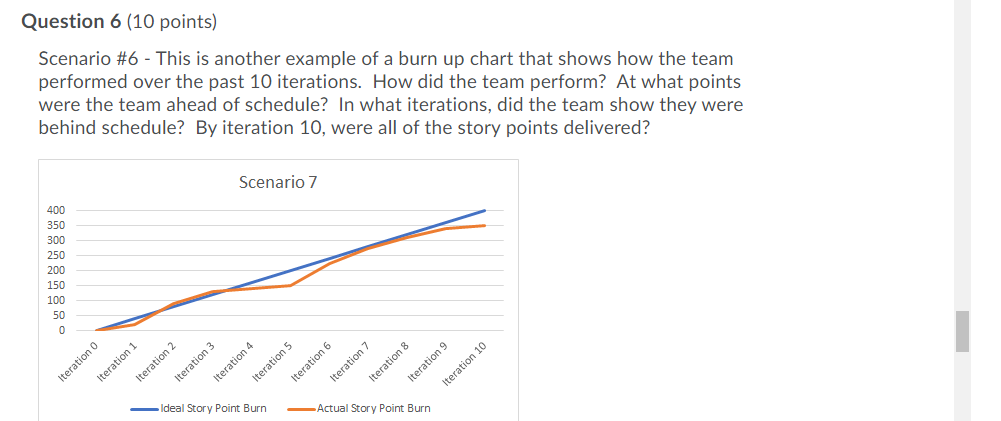
Question: Question 6 (10 points) Scenario #6 - This is another example of a burn up chart that shows how the team performed over the past

Question 6 (10 points) Scenario #6 - This is

Question 6 (10 points) Scenario #6 - This is another example of a burn up chart that shows how the team performed over the past 10 iterations. How did the team perform? At what points were the team ahead of schedule? In what iterations, did the team show they were behind schedule? By iteration 10, were all of the story points delivered? Scenario 7 400 350 300 250 200 150 100 50 0 Iteration 2 Iteration 3 Iteration 4 Iteration 7 Iteration 8 Iteration 9 Iteration 10 Iteration 0 Iteration 1 Iteration 5 Iteration 6 -Ideal Story Point Burn Actual Story Point Burn

Step by Step Solution

There are 3 Steps involved in it

1 Expert Approved Answer
Step: 1 Unlock blur-text-image
Question Has Been Solved by an Expert!

Get step-by-step solutions from verified subject matter experts

Step: 2 Unlock
Step: 3 Unlock

Students Have Also Explored These Related General Management Questions!