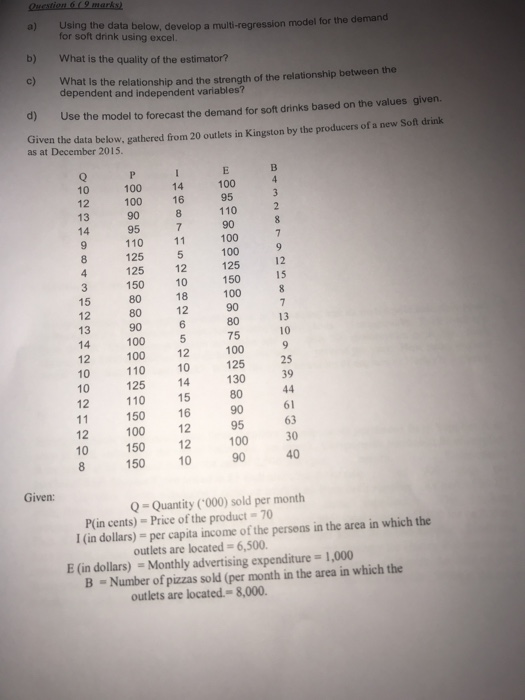
Question: Question 6 (9 marks) using the data below, develop a multi-regression model for the demand for soft drink using excel b) What is the quality

Question 6 (9 marks) using the data below,
Question 6 (9 marks) using the data below, develop a multi-regression model for the demand for soft drink using excel b) What is the quality of the estimator? What is the relationship and the strength of the relationship between the dependent and independent variables? use the model to forecast the demand for soft drinks based on the values given Given the data below, gathered from 20 outlets in Kingston by the producers of a new Soft drink as at December 2015. 10 - 14 100 100 100 95 110 95 110 100 125 100 125 125 150 80 110 40 150 Given: Q = Quantity ('000) sold per month P(in cents) = Price of the product - 70 I in dollars) = per capita income of the persons in the area in which the outlets are located -6,500. E (in dollars) = Monthly advertising expenditure = 1,000 B = Number of pizzas sold (per month in the area in which the outlets are located.- 8,000

Step by Step Solution

There are 3 Steps involved in it

1 Expert Approved Answer
Step: 1 Unlock blur-text-image
Question Has Been Solved by an Expert!

Get step-by-step solutions from verified subject matter experts

Step: 2 Unlock
Step: 3 Unlock

Students Have Also Explored These Related General Management Questions!