

Question: Question 6: Before we conduct any analyses, the data needs to be cleaned of errors. We refer to this process as data cleaning . One
Question 6:
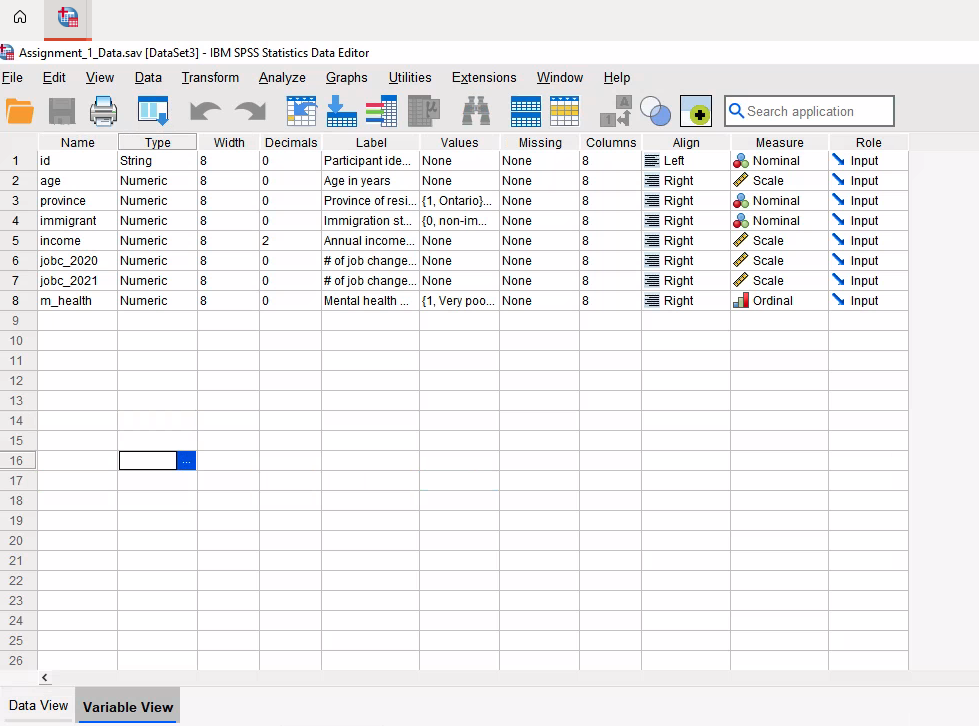
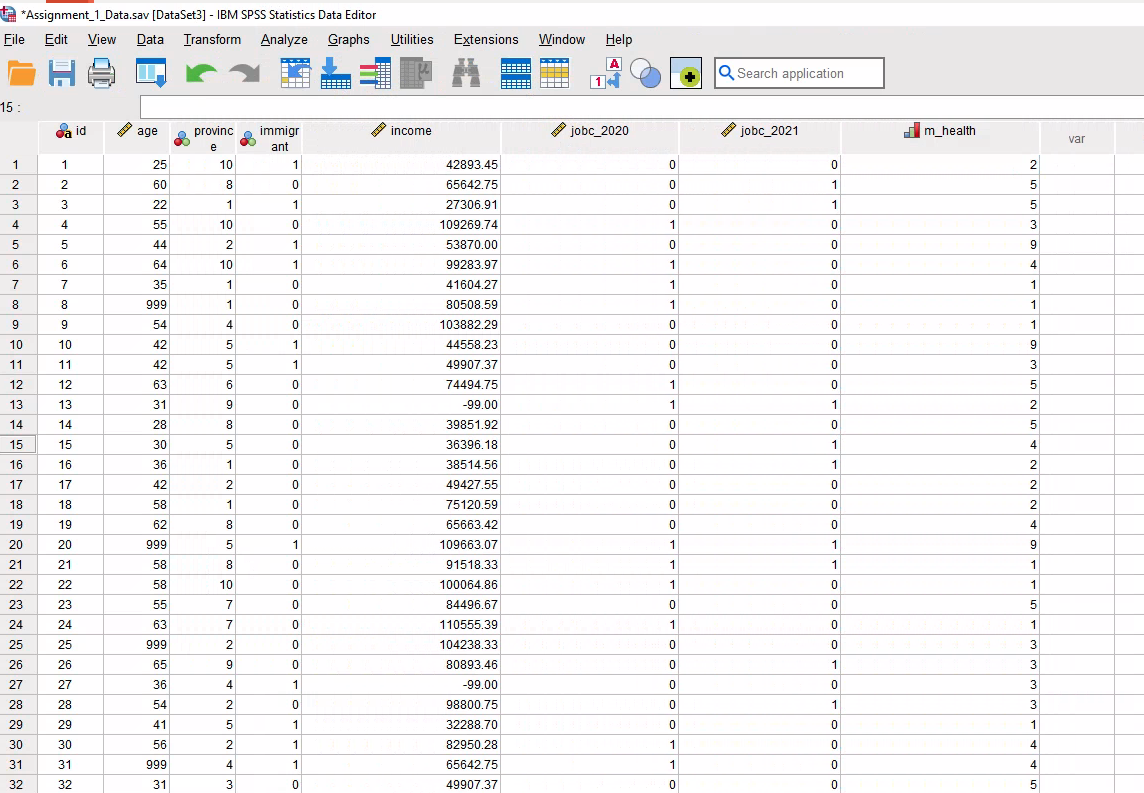
Before we conduct any analyses, the data needs to be cleaned of errors. We refer to this process as data cleaning. One aspect of data cleaning is to make sure that the values indicating "missingness" have been appropriately handled. As seen in the SPSS tutorial, you sometimes find bizarre values in your dataset that don't make sense given the nature of your variable. For example, having a negative value for age. Such values need to be identified/recoded so that SPSS does not think it is a real number during later analyses.
Found below is a data dictionary, which tells you what values participants were given if they chose not to provide information. As you can see, you only have to worry about 3 variables.
Data Dictionary: Code for missing values
Variable Name | Code for unreported values |
Age | 999 |
Province | None |
Immigrant | None |
Income | -99 |
Jobc_2020 | None |
Jobc_2021 | None |
M_health | 9 |
Task:The variables, age, income, and m_health contain missingness. As shown in class, handle the missingness in each variable. After cleaning each variable, create a frequency table and histogram for each variable and paste a screenshot below. (9 marks)
Frequency Table for Age:
Histogram for Age:
Frequency Table for Income:
Histogram for Income:
Frequency Table for m_health:
Histogram for m_health:

Assignment_1_Data.sav [DataSet3] - IBM SPSS Statistics Data Editor File Edit View Data Transform Analyze e Graphs Utilities Extensions Window Help Q. Search application Name Type Width Decimals Label Values Missing Columns Align Measure Role 1 id String Participant ide... None None 8 Lef Nominal Input 2 age Numeric 8 0 Age in years None None 8 Right Input 3 province Numeric 8 Right Nominal CO 10 Province of resi... {1, Ontario)... None `Input 4 immigrant Numeric 8 Right CO 0 Immigration st... {0, non-im... None Nominal Input Numeric 8 12 Annual income... None None 8 Right Input income Scale 6 jobc_2020 Numeric 0 # of job change... None None 8 Right Scale Input 7 jobc_2021 Numeric CO # of job change... None None 8 Right Scale Input 8 Numeric 8 Mental health ... {1, Very poo... I . None 8 m_health Right Ordinal Input 9 10 11 12 13 14 15 16 17 18 19 20 21 22 23 24 25 26 Data View Variable View*Assignment_1_Data.sav [DataSet3] - IBM SPSS Statistics Data Editor File Edit View Data Transform Analyze Graphs Utilities Extensions Window Help A H + Q. Search application 15 : immigr jobc_2020 jobc_2021 Im_health Said 4 age 4 income var proving e ant 25 10 42893.45 50 8 0 65642.75 W N - 22 27306.91 55 10 109269.74 - - 0 - 0 44 IN 53870.00 64 10 99283.97 35 41604.27 999 80508.59 6 00 34 103882.29 10 10 42 44558.23 11 11 42 49907.37 12 12 63 74494.75 13 31 -99.00 14 14 28 39851.92 15 15 30 36396.18 16 16 36 38514.56 17 17 42 49427.55 18 18 58 75120.59 19 19 62 65663.42 20 20 999 109663.07 o- - - 0 21 21 68 91518.33 22 22 58 10 100064.86 23 23 55 84496.67 24 24 63 110555.39 25 25 999 104238.33 26 26 65 80893.46 27 27 36 -99.00 ANONAONNN 28 28 54 98800.75 29 29 41 32288.70 30 30 56 82950.28 O - - 31 31 999 65642.75 o - 32 32 31 49907.37*Assignment_1_Data.sav [DataSet3] - IBM SPSS Statistics Data Editor Utilities Extensions Window Help File Edit View Data Transform Analyze Graphs A Q Search application H m_health 15 jobc_2020 jobc_2021 ba id Provinc Immigr income age e ant 0 100064.86 22 22 58 0 84496.67 23 23 55 0 110555.39 24 24 53 25 199 0 104238.33 25 0 80893.46 26 26 65 -99.00 27 27 36 98800.75 28 28 54 32288.70 29 29 41 82950.28 30 30 56 65642.75 31 31 999 49907.37 32 32 31 109269.74 33 33 63 109759.46 34 34 59 39851.92 35 35 41 67969.67 36 36 49 38514.56 37 37 41 103882.29 38 38 65 52863.32 39 39 44 29424.43 10 40 40 27 -99.00 41 41 61 98646.43 42 42 65 76845.01 43 43 46 37459.54 44 44 27 69503.76 45 45 60 -99.00 46 46 999 53870.00 47 47 27 65663.42 48 48 45 109663.07 49 49 53 32288.70 50 50 35 51
Step by Step Solution
There are 3 Steps involved in it

Get step-by-step solutions from verified subject matter experts