

Question: Question 7 0 / 10 points Use the following table and MS Excel to produce two forecasts for January 2020, the simple naive model and
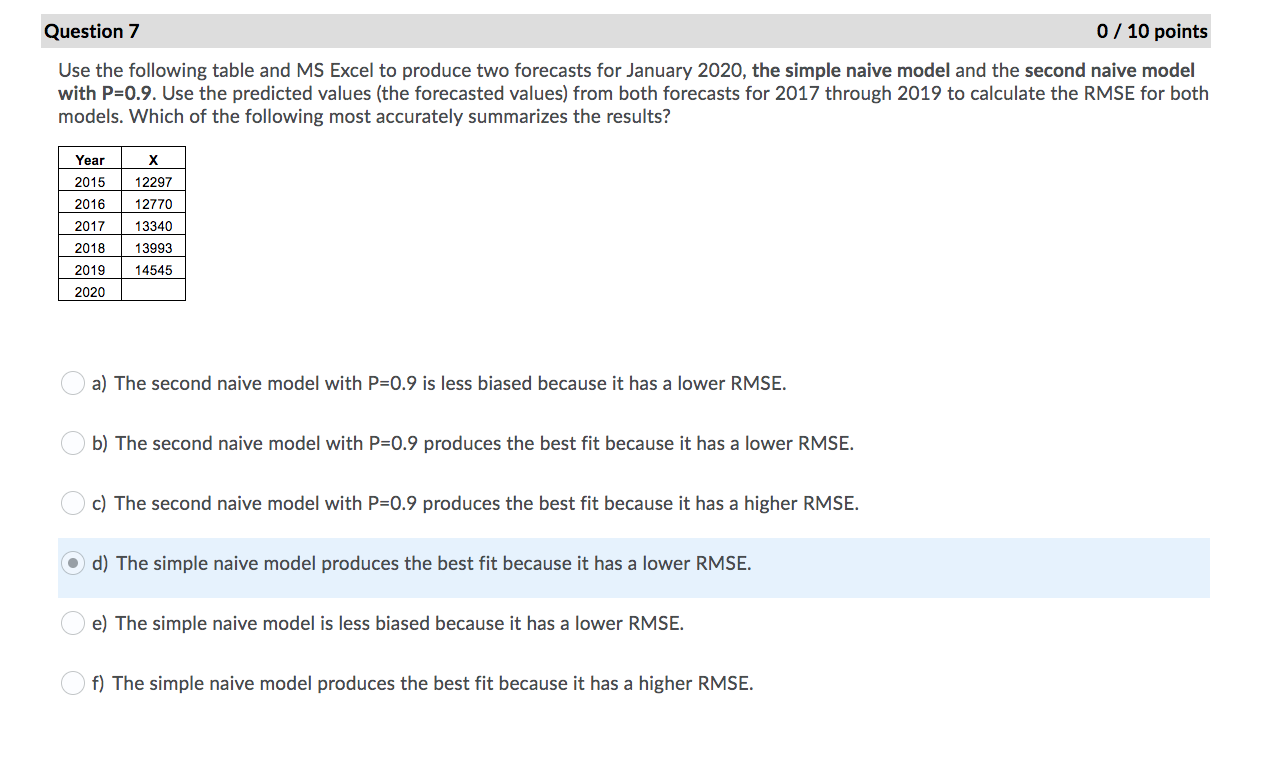
Question 7 0 / 10 points Use the following table and MS Excel to produce two forecasts for January 2020, the simple naive model and the second naive model with P=0.9. Use the predicted values (the forecasted values) from both forecasts for 2017 through 2019 to calculate the RMSE for both models. Which of the following most accurately summarizes the results? Year 12297 2015 2016 12770 13340 2017 2018 13993 14545 2019 2020 a) The second naive model with P=0.9 is less biased because it has a lower RMSE. b) The second naive model with P=0.9 produces the best fit because it has a lower RMSE. c) The second naive model with P=0.9 produces the best fit because it has a higher RMSE. d) The simple naive model produces the best fit because it has a lower RMSE. e) The simple naive model is less biased because it has a lower RMSE. f) The simple naive model produces the best fit because it has a higher RMSE
Step by Step Solution
There are 3 Steps involved in it

Get step-by-step solutions from verified subject matter experts