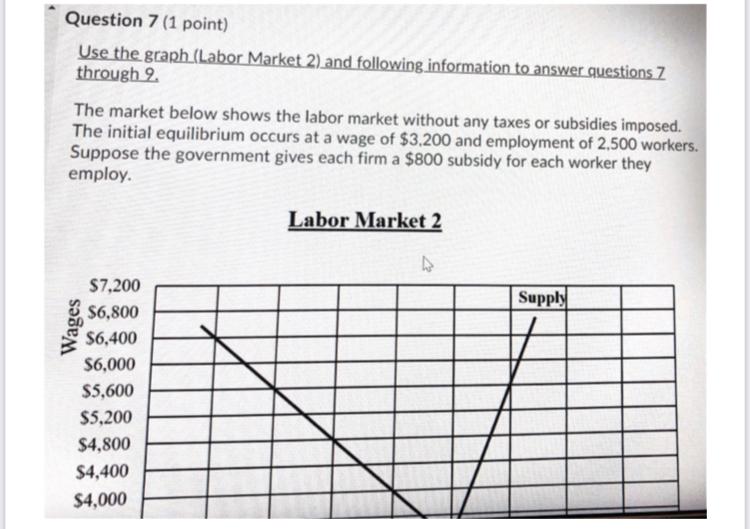
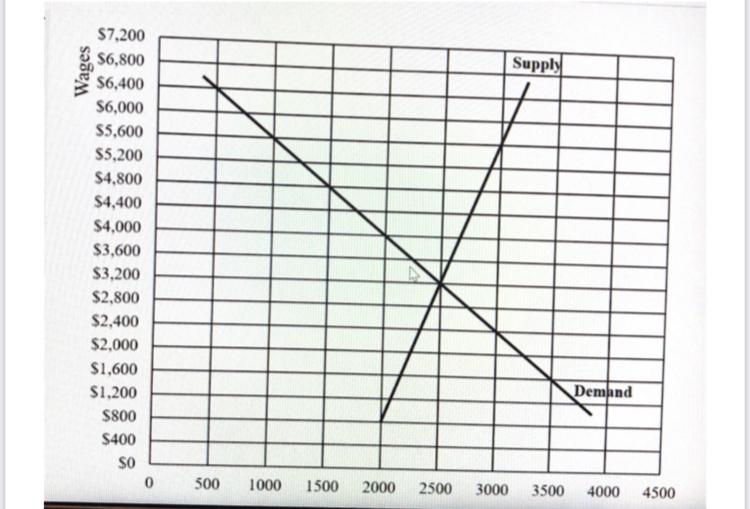
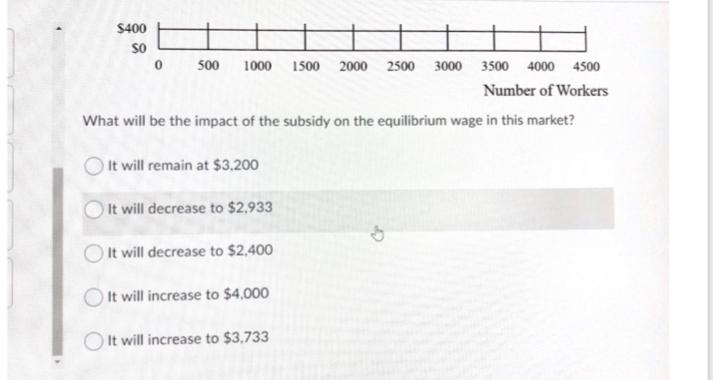
Question: Question 7 (1 point) Use the graph (Labor Market 2) and following information to answer questions. Z through 2. The market below shows the labor

Question 7 (1 point) Use the graph (Labor MarketQuestion 7 (1 point) Use the graph (Labor MarketQuestion 7 (1 point) Use the graph (Labor Market

Question 7 (1 point) Use the graph (Labor Market 2) and following information to answer questions. Z through 2. The market below shows the labor market without any taxes or subsidies imposed. The initial equilibrium occurs at a wage of $3,200 and employment of 2,500 workers. Suppose the government gives each firm a $800 subsidy for each worker they employ. Labor Market 2 Supply Wages $7,200 $6,800 $6,400 $6,000 $5,600 $5,200 $4,800 $4,400 $4,000 Wages Supply $7.200 S6,800 $6,400 $6,000 $5,600 $5,200 $4,800 $4,400 $4,000 $3,600 $3,200 $2,800 $2,400 $2,000 $1,600 $1,200 S800 $400 SO 0 Demand 500 1000 1500 2000 2500 3000 3500 4000 4500 $400 SO 0 500 1000 1500 2000 2500 3000 3500 4000 4500 Number of Workers What will be the impact of the subsidy on the equilibrium wage in this market? It will remain at $3,200 It will decrease to $2,933 It will decrease to $2,400 It will increase to $4,000 It will increase to $3.733

Step by Step Solution

There are 3 Steps involved in it

1 Expert Approved Answer
Step: 1 Unlock blur-text-image
Question Has Been Solved by an Expert!

Get step-by-step solutions from verified subject matter experts

Step: 2 Unlock
Step: 3 Unlock

Students Have Also Explored These Related General Management Questions!