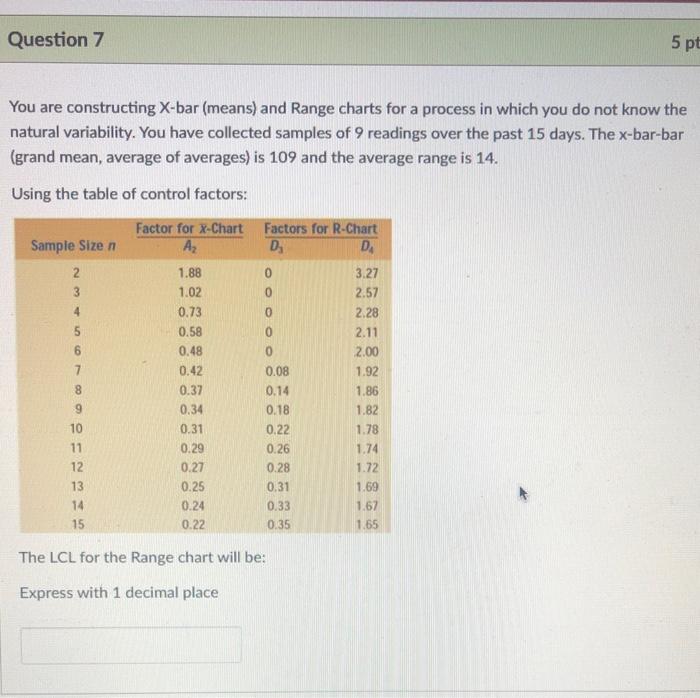
Question: Question 7 5 pt You are constructing X-bar (means) and Range charts for a process in which you do not know the natural variability. You

Question 7 5 pt You are constructing X-bar
Question 7 5 pt You are constructing X-bar (means) and Range charts for a process in which you do not know the natural variability. You have collected samples of 9 readings over the past 15 days. The x-bar-bar (grand mean, average of averages) is 109 and the average range is 14. Using the table of control factors: Factor for X-Chart Factors for R-Chart Az Di D Sample Size 2 0 0 0 3 4 5 6 7 0 8 1.88 1.02 0.73 0.58 0.48 0.42 0.37 0.34 0.31 0.29 0.27 0.25 0.24 0.22 3.27 2.57 2.28 2.11 2.00 1.92 1.86 1.82 1.78 1.74 1.72 1.69 1.67 1.65 9 0 0.08 0.14 0.18 0.22 0.26 0.28 0.31 0.33 0.35 10 11 12 13 14 15 The LCL for the Range chart will be: Express with 1 decimal place

Step by Step Solution

There are 3 Steps involved in it

1 Expert Approved Answer
Step: 1 Unlock blur-text-image
Question Has Been Solved by an Expert!

Get step-by-step solutions from verified subject matter experts

Step: 2 Unlock
Step: 3 Unlock

Students Have Also Explored These Related General Management Questions!