

Question: Question 7 For this exercise we will make use of data that records the the quarterly approval rating for the President of the United States
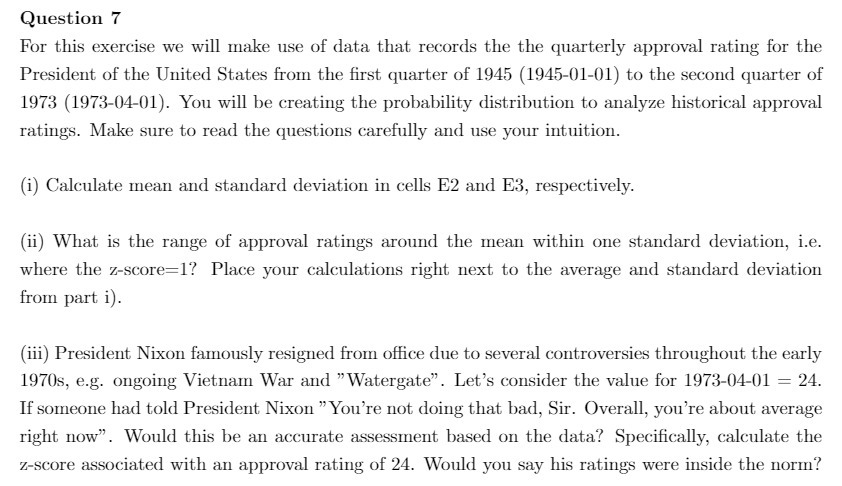
Question 7 For this exercise we will make use of data that records the the quarterly approval rating for the President of the United States from the first quarter of 1945 (1945-01-01) to the second quarter of 1973 (1973-04-01). You will be creating the probability distribution to analyze historical approval ratings. Make sure to read the questions carefully and use your intuition. (i) Calculate mean and standard deviation in cells E2 and E3, respectively. (ii) What is the range of approval ratings around the mean within one standard deviation, i.e. where the z-score=1? Place your calculations right next to the average and standard deviation from part i). (iii) President Nixon famously resigned from office due to several controversies throughout the early 1970s, e.g. ongoing Vietnam War and "Watergate". Let's consider the value for 1973-04-01 = 24. If someone had told President Nixon " You're not doing that bad, Sir. Overall, you're about average right now". Would this be an accurate assessment based on the data? Specifically, calculate the z-score associated with an approval rating of 24. Would you say his ratings were inside the norm
Step by Step Solution
There are 3 Steps involved in it

Get step-by-step solutions from verified subject matter experts