

Question: Question 7 Here is a bivariate data set. X y 73.4 30.4 83.1 113.5 64.7 64.1 68.2 108.4 71.5 77.7 69.8 39.1 80.2 137.7 65.2
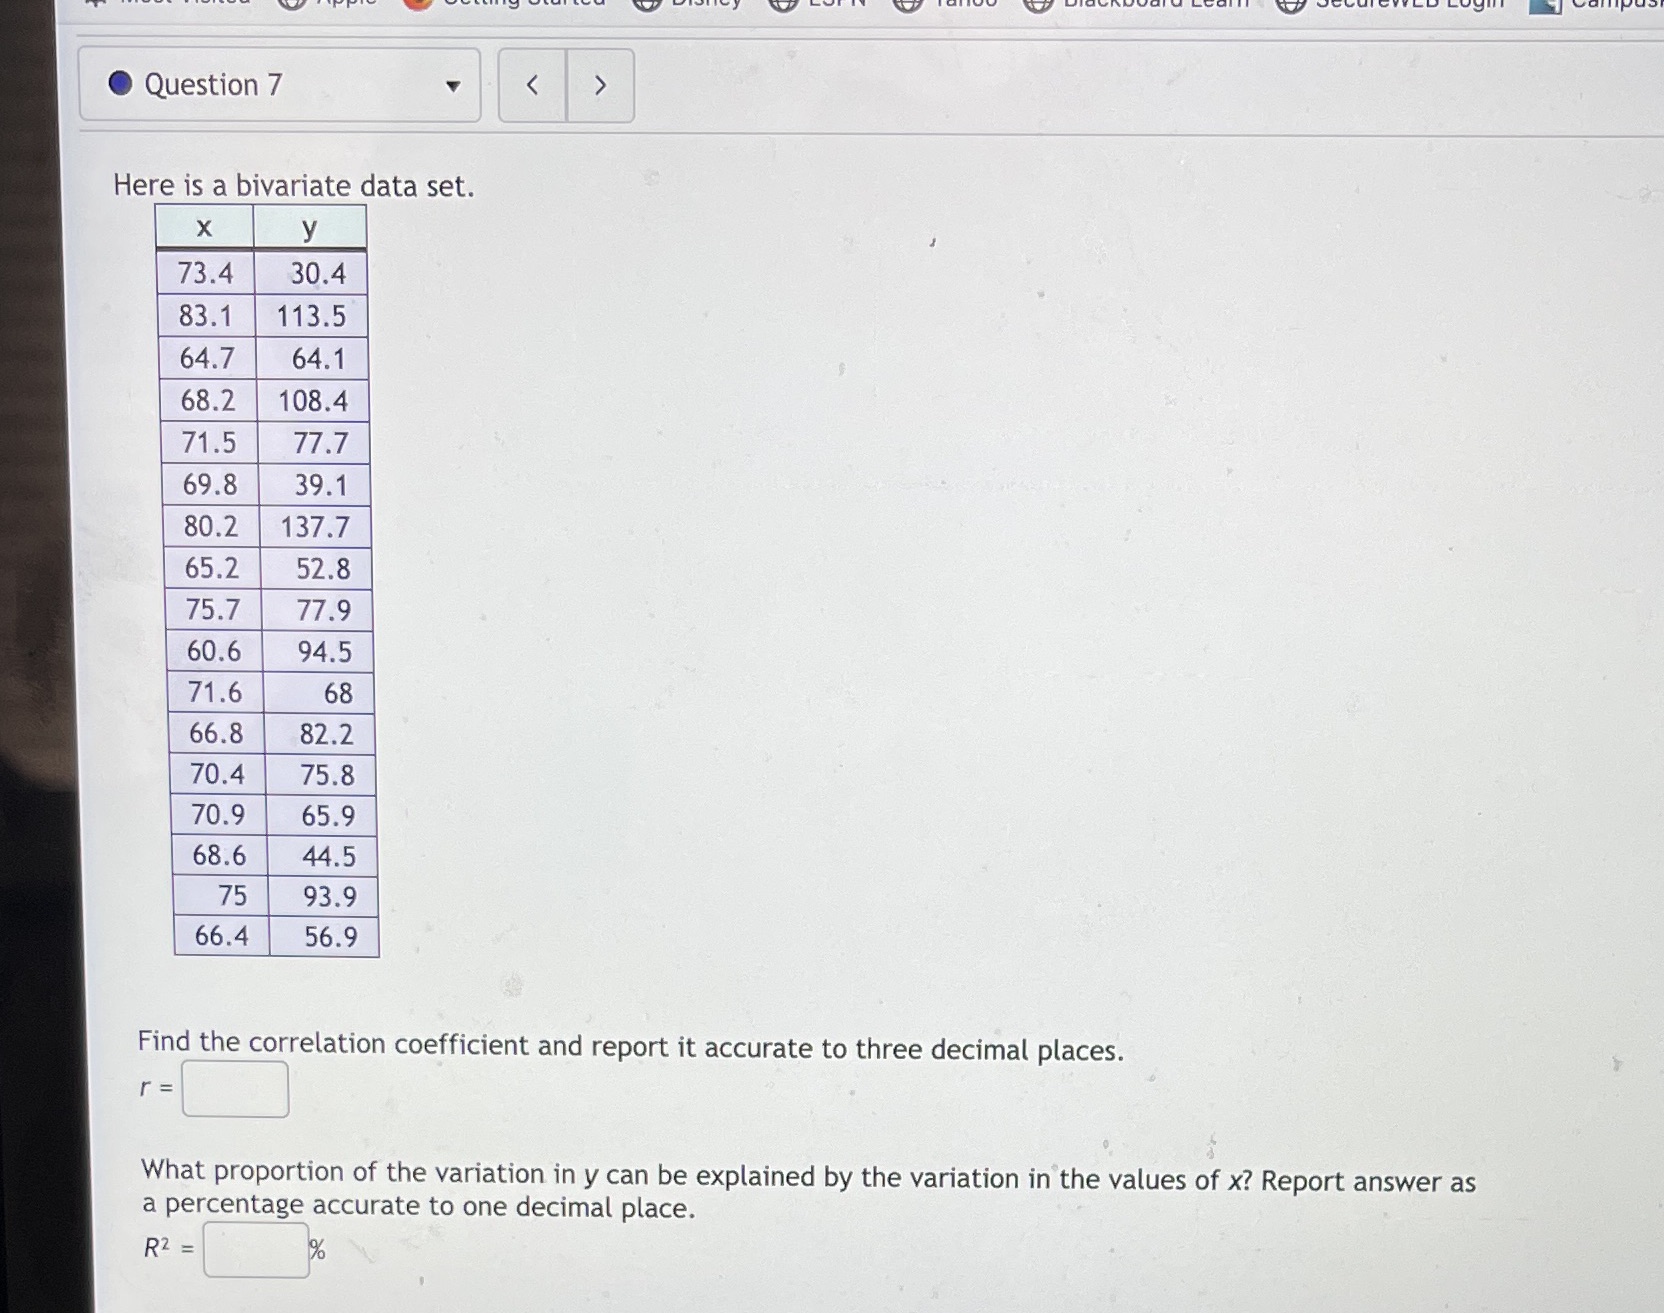
Question 7 Here is a bivariate data set. X y 73.4 30.4 83.1 113.5 64.7 64.1 68.2 108.4 71.5 77.7 69.8 39.1 80.2 137.7 65.2 52.8 75.7 77.9 60.6 94.5 71.6 68 66.8 82.2 70.4 75.8 70.9 65.9 68.6 44.5 75 93.9 66.4 56.9 Find the correlation coefficient and report it accurate to three decimal places. r = What proportion of the variation in y can be explained by the variation in the values of x? Report answer as a percentage accurate to one decimal place. R2 = %
Step by Step Solution
There are 3 Steps involved in it
1 Expert Approved Answer
Step: 1 Unlock

Question Has Been Solved by an Expert!
Get step-by-step solutions from verified subject matter experts
Step: 2 Unlock
Step: 3 Unlock