

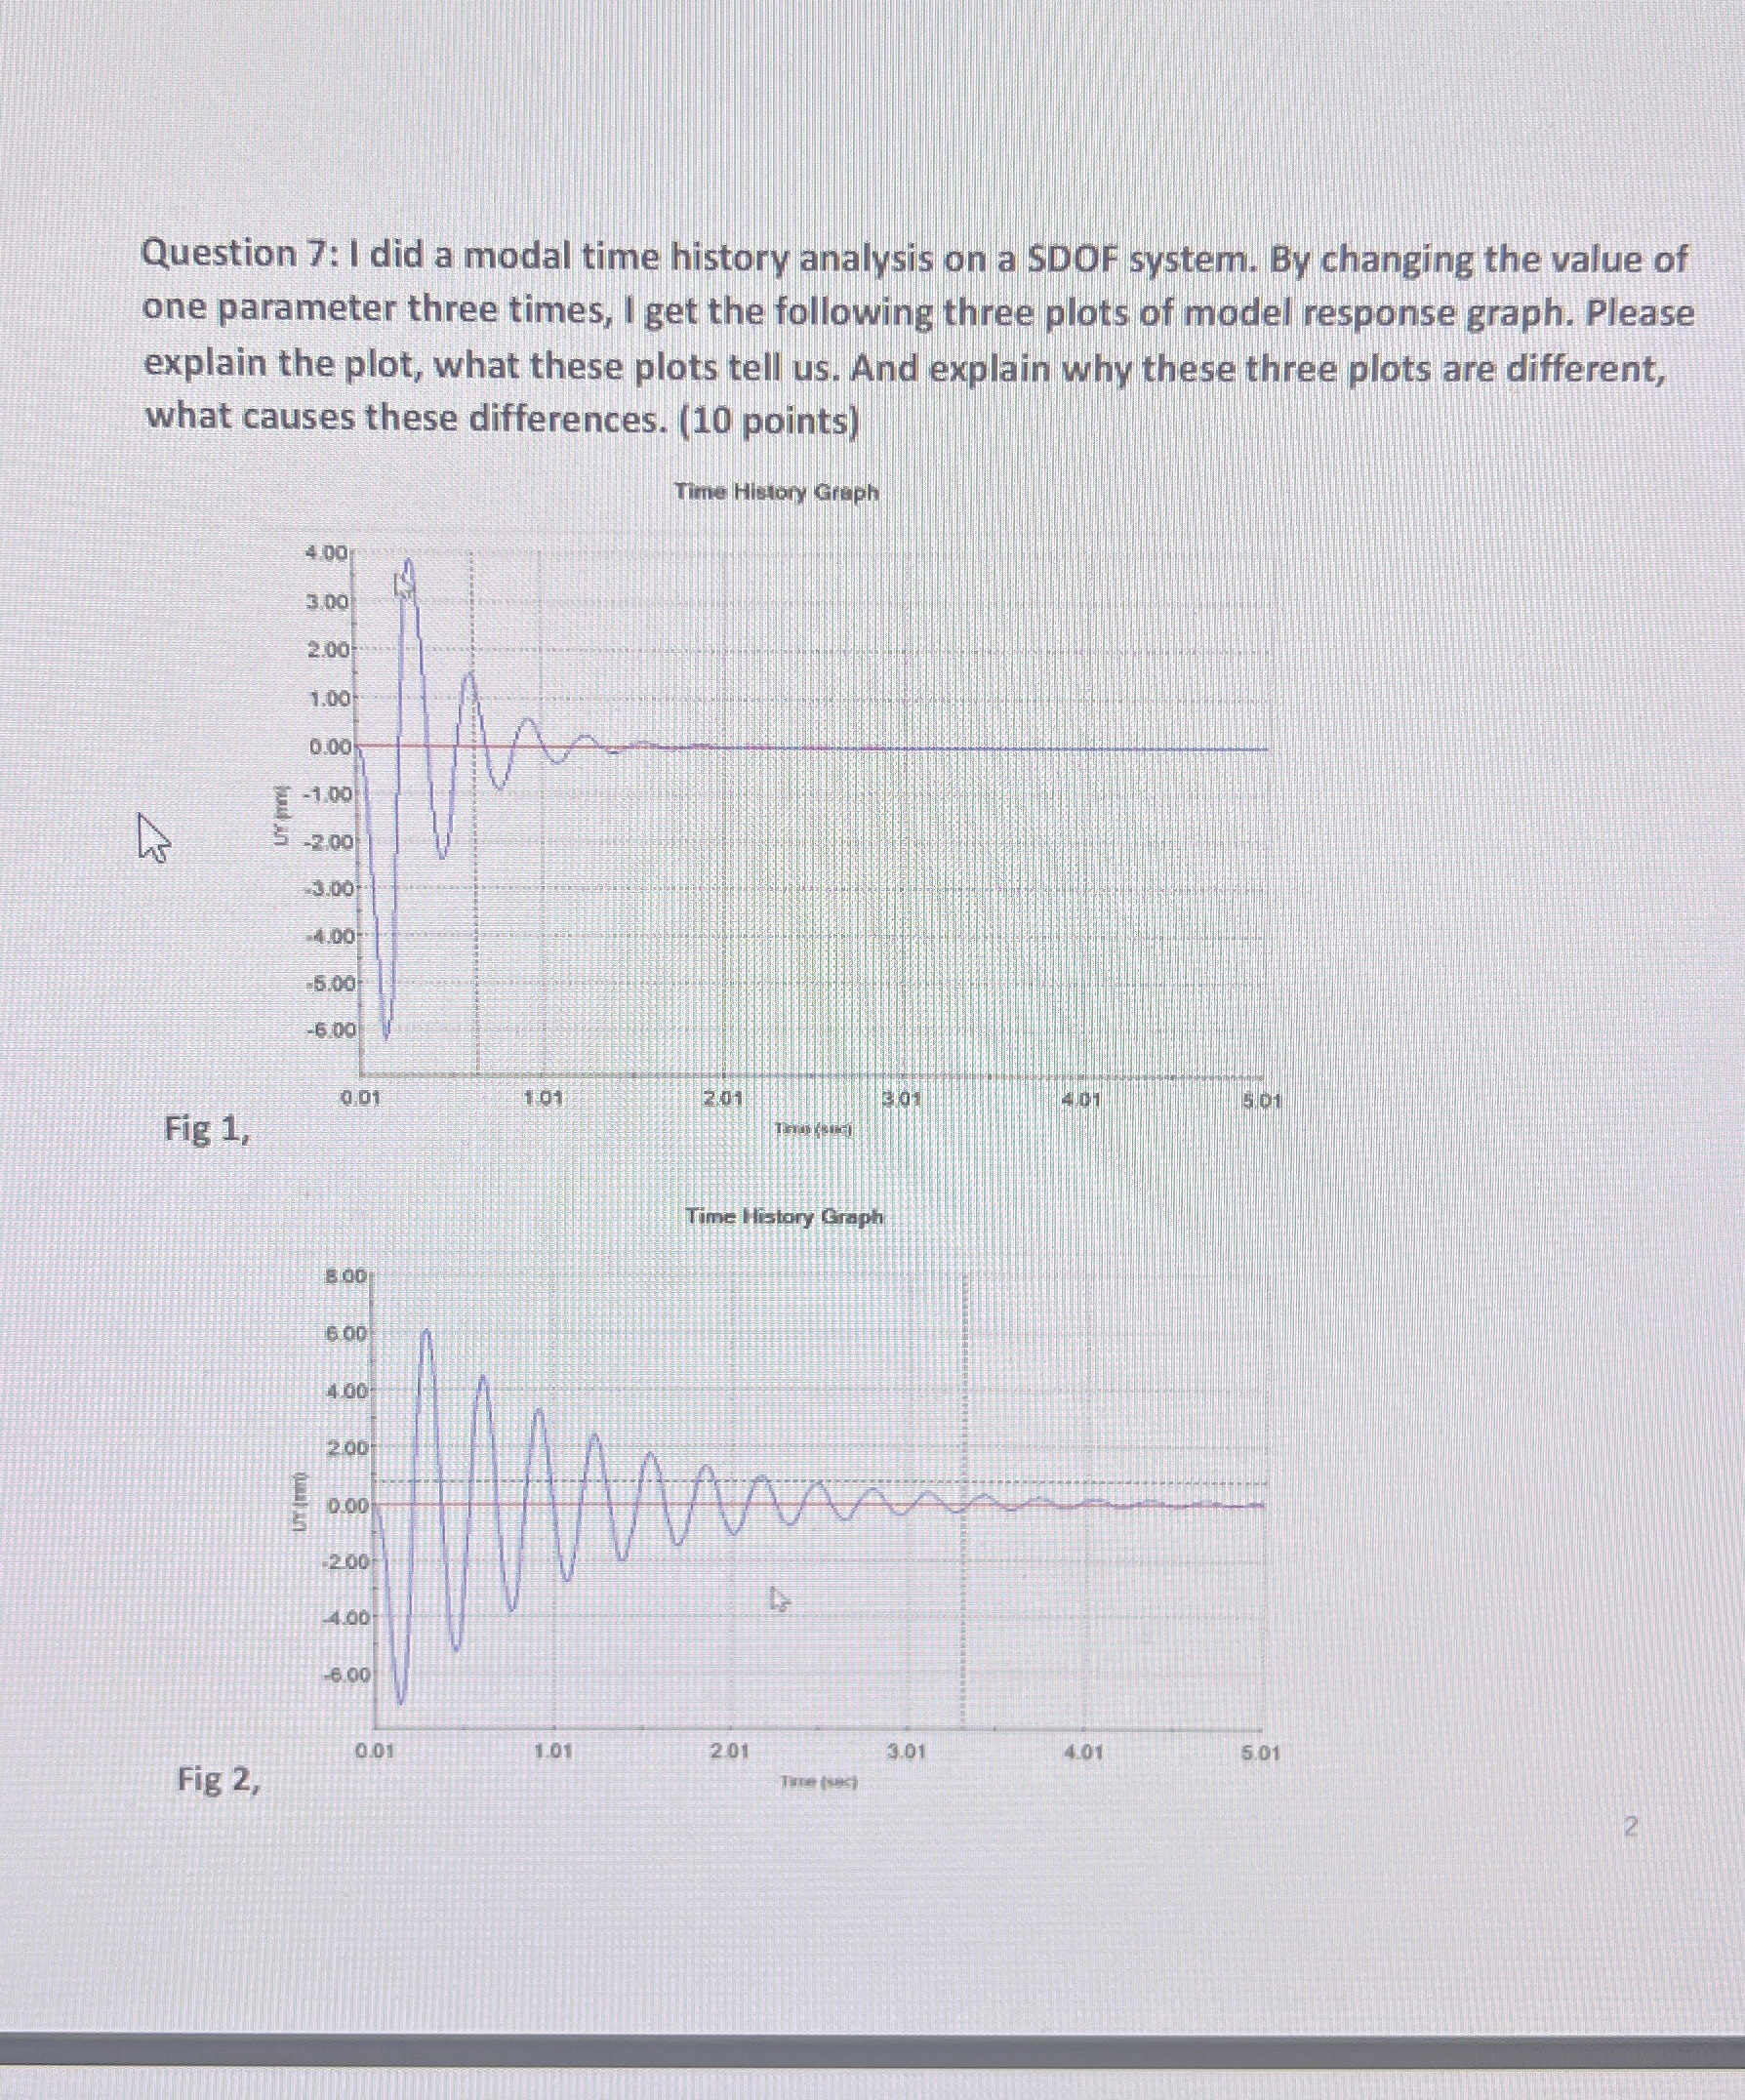
Question: Question 7 : I did a modal time history analysis on a SDOF system. By changing the value of one parameter three times, I get
Question : I did a modal time history analysis on a SDOF system. By changing the value of one parameter three times, I get the following three plots of model response graph. Please explain the plot, what these plots tell us And explain why these three plots are different, what causes these differences. points
Time Histony Graph
Step by Step Solution
There are 3 Steps involved in it
1 Expert Approved Answer
Step: 1 Unlock

Question Has Been Solved by an Expert!
Get step-by-step solutions from verified subject matter experts
Step: 2 Unlock
Step: 3 Unlock