

Question: Question 8 (2.5 points) e 1: A scatterplot shows a set of data points that are clustered very close to a line that 2 3
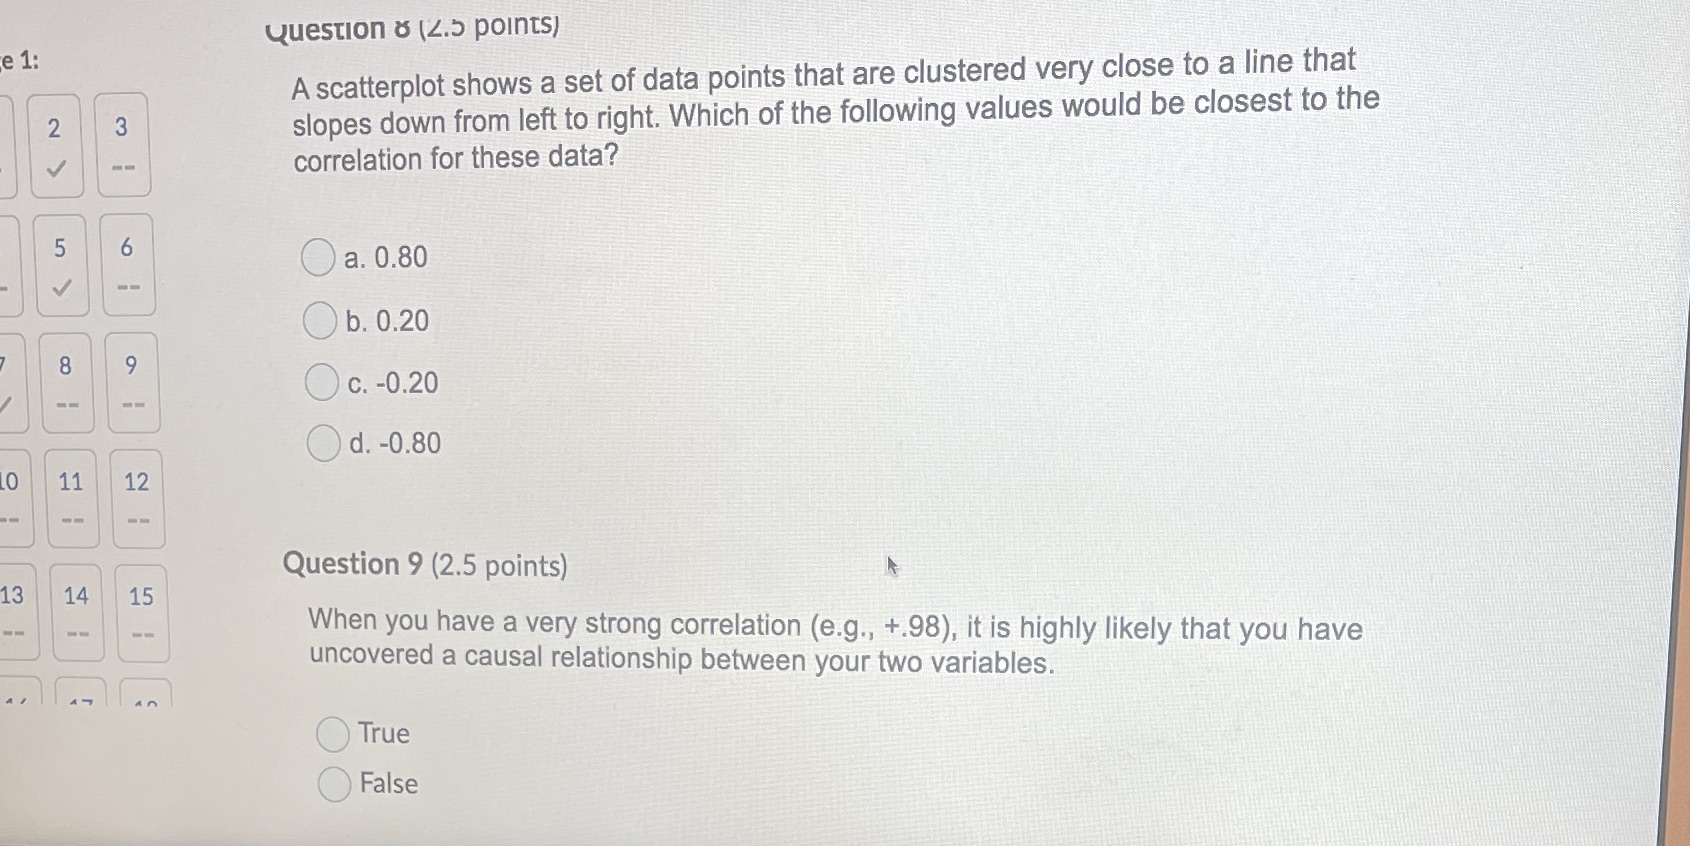
Question 8 (2.5 points) e 1: A scatterplot shows a set of data points that are clustered very close to a line that 2 3 slopes down from left to right. Which of the following values would be closest to the correlation for these data? UT 6 O a. 0.80 O b. 0.20 8 9 O c. -0.20 Od. -0.80 0 11 12 Question 9 (2.5 points) 13 14 15 When you have a very strong correlation (e.g., +.98), it is highly likely that you have uncovered a causal relationship between your two variables. an True False
Step by Step Solution
There are 3 Steps involved in it
1 Expert Approved Answer
Step: 1 Unlock

Question Has Been Solved by an Expert!
Get step-by-step solutions from verified subject matter experts
Step: 2 Unlock
Step: 3 Unlock