

Question: Question 9 Comparative financial statement data for Ivanhoe Company and Sheridan Company, two competitors, appear below. All balance sheet data are as of December 31,
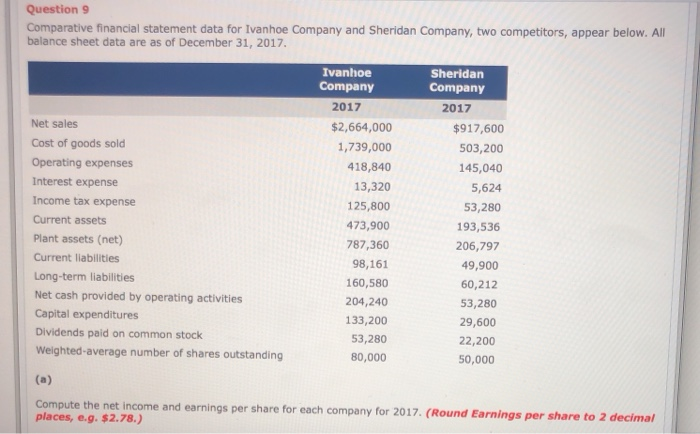
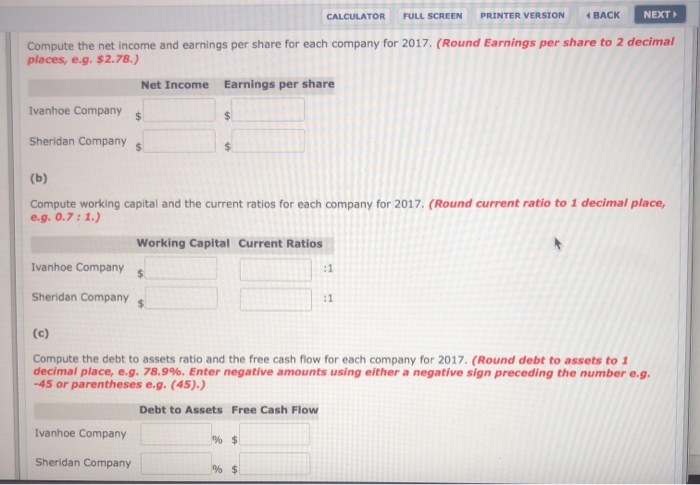
Question 9 Comparative financial statement data for Ivanhoe Company and Sheridan Company, two competitors, appear below. All balance sheet data are as of December 31, 2017 Ivanhoe Company 2017 Net sales Cost of goods sold Operating expenses Interest expense Income tax expense Current assets Plant assets (net) Current liabilities Long-term liabilities Net cash provided by operating activities Capital expenditures Dividends paid on common stock Weighted average number of shares outstanding $2,664,000 1,739,000 418,840 13,320 125,800 473,900 787,360 98,161 160,580 204,240 133,200 53,280 80,000 Sheridan Company 2017 $917,600 503,200 145,040 5,624 53,280 193,536 206,797 49,900 60,212 53,280 29,600 22,200 50,000 Compute the net income and earnings per share for each company for 2017. (Round Earnings per share to 2 decimal places, e.g. $2.78.) CALCULATOR FULL SCREEN PRINTER VERSION BACK NEXT Compute the net income and earnings per share for each company for 2017. (Round Earnings per share to 2 decimal places, e.g. $2.78.) Net Income Earnings per share Ivanhoe Company $ Sheridan Companys (b) Compute working capital and the current ratios for each company for 2017. (Round current ratio to 1 decimal place, e.g. 0.7: 1.) Working Capital Current Ratios Ivanhoe Company Sheridan Companys (c) Compute the debt to assets ratio and the free cash flow for each company for 2017. (Round debt to assets to 1 decimal place, e.g. 78.9%. Enter negative amounts using either a negative sign preceding the number e.g. -45 or parentheses e.g. (45).) Debt to Assets Free Cash Flow Ivanhoe Company % $ Sheridan Company
Step by Step Solution
There are 3 Steps involved in it

Get step-by-step solutions from verified subject matter experts